The SaaS M&A Preparation Playbook
12–24 Months Before Your Exit
This report is a step-by-step guide for SaaS CEOs preparing their companies for acquisition. Drawing on data from over 540 private SaaS M&A transactions, interviews with leading M&A advisors, and analysis of 2,698 SaaS deals completed in 2025, it covers everything from financial cleanup and metric optimization to legal preparation, buyer targeting, deal structure, and the common mistakes that destroy value. Whether your exit is 6 months away or 24, the playbook inside will help you maximize the outcome.
This report is published by SaasRise, the #1 mastermind community for SaaS CEOs with $1M–$100M+ in ARR. Members have collectively raised $1B+ and have $3B+ in ARR.
📋 Table of Contents
- Executive Summary: The Preparation Premium
- The 2026 SaaS M&A Market & Buyer Universe
- The 8 Metrics That Drive Your Multiple
- The 24-Month Exit Preparation Timeline
- Financial Cleanup & the NRR Plays
- Operational, Legal & Technical Readiness
- Advisors, Process & Deal Structure
- The 17 Deal Killers
- Case Studies: Exits Done Right and Wrong
- Exit Readiness Scorecard & Key Takeaways
Key Report Findings
SaaS M&A hit an all-time record of 2,698 transactions in 2025, up 28% year-over-year, with $3.7 trillion in private equity dry powder fueling intense competition for quality assets. Yet the market is increasingly barbell-shaped: the average deal multiple reached 5.5x while the median held at 4.1x, meaning a small cohort of well-prepared companies captured outsized premiums while the majority traded at modest valuations. This report shows how preparation — specifically, the work done 12 to 24 months before going to market — is the single most controllable lever for landing in the top quartile rather than the median.
Executive Summary: The Preparation Premium
The central finding of this report is straightforward: preparation is the highest-ROI activity in the entire exit process. Not market timing. Not hiring the most expensive banker. Not waiting for one more quarter of growth. The work you do in the 12 to 24 months before going to market — optimizing your metrics, cleaning your financials, strengthening your management team, resolving legal and IP issues, and setting up a competitive sale process — consistently produces 20–40% higher net proceeds than rushing to market, regardless of market conditions.
Consider a company with $10 million in ARR. An unprepared founder selling to a single buyer with three months of preparation typically achieves 3–4x ARR, or $30–40 million. The same company — same product, same customers, same revenue — with 18 months of strategic preparation, optimized NRR, clean financials, and a competitive process among four or more buyers routinely sells for 6–7x ARR, or $60–70 million. That is a $30–35 million difference on the same underlying business.
The reason is simple: buyers are not just buying your current revenue — they are buying the durability and predictability of that revenue. Every piece of preparation work, from improving NRR to documenting processes to securing IP assignments, directly addresses the risk factors that buyers use to justify lower multiples. Remove the risks, and the multiple expands.
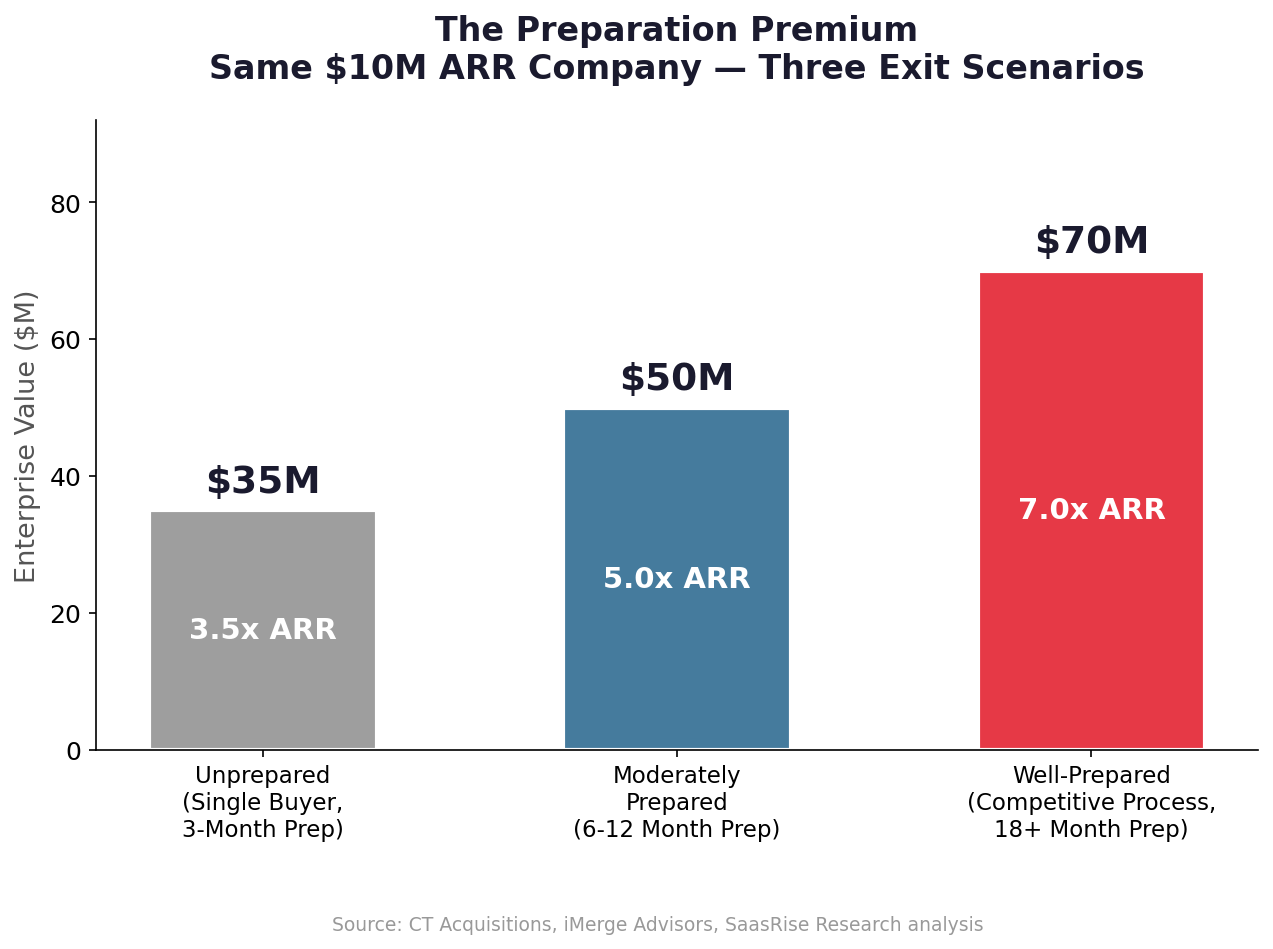
Figure 1: The same $10M ARR company produces dramatically different outcomes depending on preparation and process.
The Bottom Line: Unprepared founders lose 15–25% of headline value through diligence re-trades, single-buyer discounts, and avoidable deal structure concessions. The work you do in the 12–24 months before going to market determines more of your outcome than market timing.
1. The 2026 SaaS M&A Market & Buyer Universe
A Record-Breaking Market
SaaS M&A activity reached its highest level on record in 2025, with 2,698 transactions — a 28% increase year-over-year. SaaS deals accounted for approximately 58% of all software M&A, consistent with recent years but at historically high absolute volume. Total software M&A hit 4,629 transactions, surpassing the prior 2022 peak by roughly 1,000 deals.
Several structural forces are driving this surge. First, $3.7 trillion in private equity dry powder is creating intense competition for quality SaaS assets, with PE/VC-backed buyers involved in 58% of all SaaS transactions in 2025. Second, 68% of enterprise CIOs are planning vendor consolidation, making strategic acquisition a faster path to platform completeness than internal development. Third, AI is rewriting acquisition theses — both creating new acquisition targets (AI-native companies) and motivating legacy software companies to acquire AI capabilities they cannot build fast enough internally.
The valuation picture is increasingly bifurcated. Per Software Equity Group data, the average EV/TTM revenue multiple reached 5.5x in 2025, while the median held steady at 4.1x. This widening gap highlights a barbell-shaped market: a cohort of premium companies commanding double-digit multiples at the top, and a large base of businesses trading at 3–5x at the bottom. The difference between these outcomes is not luck — it is preparation, metrics quality, and process execution.
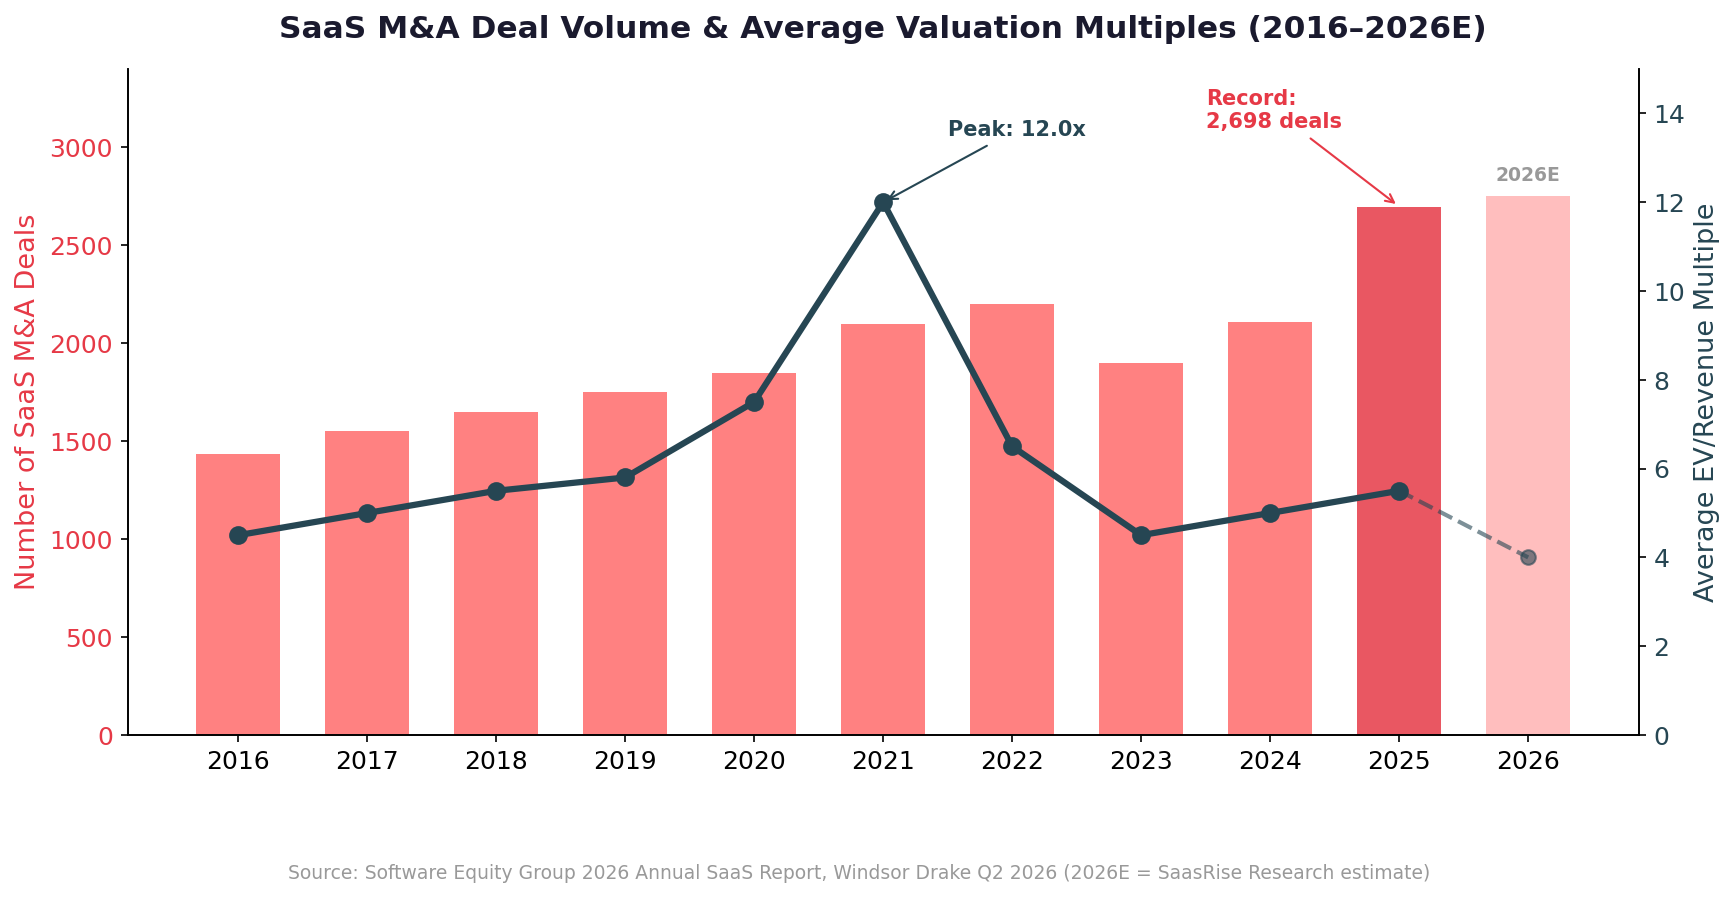
Figure 2: SaaS M&A deal volume hit an all-time record of 2,698 in 2025, while average multiples recovered but remain below 2021 peaks.
Understanding Your Buyer Universe
Not all buyers are created equal. The buyer you attract shapes your valuation, your deal structure, your post-close role, and whether your brand and team survive the transition. There are four distinct buyer types in SaaS M&A, and understanding their motivations is critical to positioning your company effectively.
Strategic acquirers accounted for 42% of all SaaS M&A deals in 2025 and typically pay the highest multiples. They buy to fill capability gaps in their own platforms — your billing module plugged into their 50,000-customer base creates value on day one that justifies a premium. Strategic buyers evaluate acquisitions through the lens of integration upside: how much incremental revenue can they generate from your product within their existing distribution? When the answer is substantial, they will pay 6–15x ARR — a premium that reflects the combined entity’s value, not your standalone economics. The trade-off: strategic buyers usually want full control, your brand may disappear, and your team gets absorbed. Founder transition periods are typically 6–12 months, and your product roadmap becomes theirs.
Private equity firms were involved in 58% of all SaaS transactions in 2025. They buy companies as financial investments, looking for margin expansion, operational improvement, and add-on acquisition opportunities over a 3–7 year hold period. Thoma Bravo alone closed $42 billion in software deals in 2025, and their founder Orlando Bravo said he is “working the hardest I’ve ever worked in 30 years.” For founders in the $5–30M ARR range, PE interest typically takes one of two forms: either you are a standalone platform investment (PE buys you, installs a management team, and grows you organically and through add-on acquisitions), or you are getting rolled into a larger portfolio company as an add-on acquisition. The platform path offers higher multiples (5–8x) but requires significant rollover equity (20–40%); the add-on path offers lower multiples (3–5x) but faster closes and cleaner terms.
Serial acquirers like Constellation Software and Roper Technologies operate a buy-and-hold permanent ownership model. Constellation Software is the most prolific acquirer in vertical software, completing dozens of acquisitions annually. They typically offer lower multiples (3–6x ARR) but provide founder-friendly terms: your brand survives, your team stays intact, and you can remain involved or transition quickly. For founders who value their team’s continuity and their product’s independence, serial acquirers offer a compelling alternative to the higher prices but higher disruption of strategic and PE exits.
Individual and search fund operators target sub-$5M ARR businesses and offer the most flexibility but the smallest checks. Search fund entrepreneurs are typically MBA graduates who raise capital to acquire and operate a single business. They bring operational energy and are often willing to structure deals creatively (seller financing, earnouts, consulting agreements), but they lack the deep pockets and integration upside of larger buyer types.

Figure 3: Strategic acquirers and PE firms dominate SaaS M&A, together accounting for over 75% of all transactions.
| Factor | Strategic Acquirer | Private Equity | Serial Acquirer | Individual / Search Fund |
|---|---|---|---|---|
| Typical ARR Target | $5M–$100M+ | $5M–$50M | $1M–$30M | <$5M |
| Typical Multiple | 6–15x ARR | 4–8x ARR | 3–6x ARR | 3–5x ARR |
| Post-Close Founder Role | 0–12 months | 2–4 years | Flexible | Full operator |
| Brand Survival | Low | Medium | High | High |
| Time to Close | 4–8 months | 3–6 months | 2–4 months | 1–3 months |
| Earnout Likelihood | Low (18%) | High (28%) | Medium | High |
| Rollover Equity | Rare | 20–40% | Rare | N/A |
Table 1: Buyer Type Comparison Matrix. Source: Software Equity Group, Livmo, FE International.
Strategic Insight: The right question is not “what would PE pay?” but “who has a capability gap my product fills?” Proactively mapping 10–20 potential strategic acquirers — companies where your product would create immediate integration value — is one of the most overlooked preparation activities. Buyers who see strategic fit pay 1.5–2.0x more than financial buyers on comparable deals.
Benchmark Your SaaS Against 400+ CEOs
SaasRise members collectively represent $3B+ in ARR. Join weekly CEO roundtables, M&A prep workshops, and peer benchmarking sessions.
2. The 8 Metrics That Drive Your Multiple
SaaS buyers evaluate acquisition targets through a specific lens of eight key metrics. Understanding where you stand on each — and which ones you can improve in 12 months — is the foundation of effective exit preparation.
1. Net Revenue Retention (NRR) — The #1 Driver
NRR is the single most correlated metric with SaaS valuation multiples. Companies with 120%+ NRR command a 50–80% premium over peers with 100% NRR at the same ARR level. Conversely, NRR below 90% causes buyers to aggressively discount your headline ARR — at 85% NRR, a buyer’s effective underwriting basis on $1M of ARR might be only $700–800K, because they expect the revenue to shrink after acquisition.
2. ARR & Growth Rate
Growth rate is the second-most important valuation driver. At the $5–20M ARR range, every 10 percentage points of additional year-over-year growth adds approximately 1–1.5x to the multiple. Companies growing 50%+ receive top-tier treatment; below 20% growth, multiples compress sharply.
3. Gross Revenue Retention (GRR)
GRR isolates how well you retain existing revenue before any upsell. GRR above 85% signals strong product-market fit; below 80% raises elevated churn concerns that most buyers cannot look past.
4. Customer Concentration
Single-customer concentration above 20% of ARR triggers a material discount. Above 25%, it becomes a diligence killer. Above 30%, it can terminate the deal entirely, because the acquirer cannot underwrite revenue that depends on a single relationship surviving the transition.
5. Gross Margin
SaaS-typical gross margins are 70–85%. Below 70% raises scalability concerns; above 85% commands a premium. Buyers scrutinize gross margin composition — hosting costs, support labor allocation, and especially AI inference costs for AI-embedded products.
6. CAC Payback Period
Under 12 months is excellent. Between 12 and 18 months is acceptable. Above 24 months signals an inefficient go-to-market motion that concerns buyers about post-acquisition unit economics.
7. Monthly Logo Churn
Below 1% monthly logo churn is enterprise-grade. Between 2–3% is SMB-grade. Above 5% indicates consumer-style dynamics that command significantly lower multiples.
8. Rule of 40 (and Rule of 50)
Revenue growth percentage plus EBITDA margin percentage. At or above 40 signals a healthy SaaS business. The top quartile of companies now achieves 50+, and a 10-point Rule of 40 improvement corresponds to approximately 1x on EV/Revenue. The balanced profile (22% growth + 18% margin) outperforms both hyper-growth-only and pure-profitability approaches in buyer evaluations.
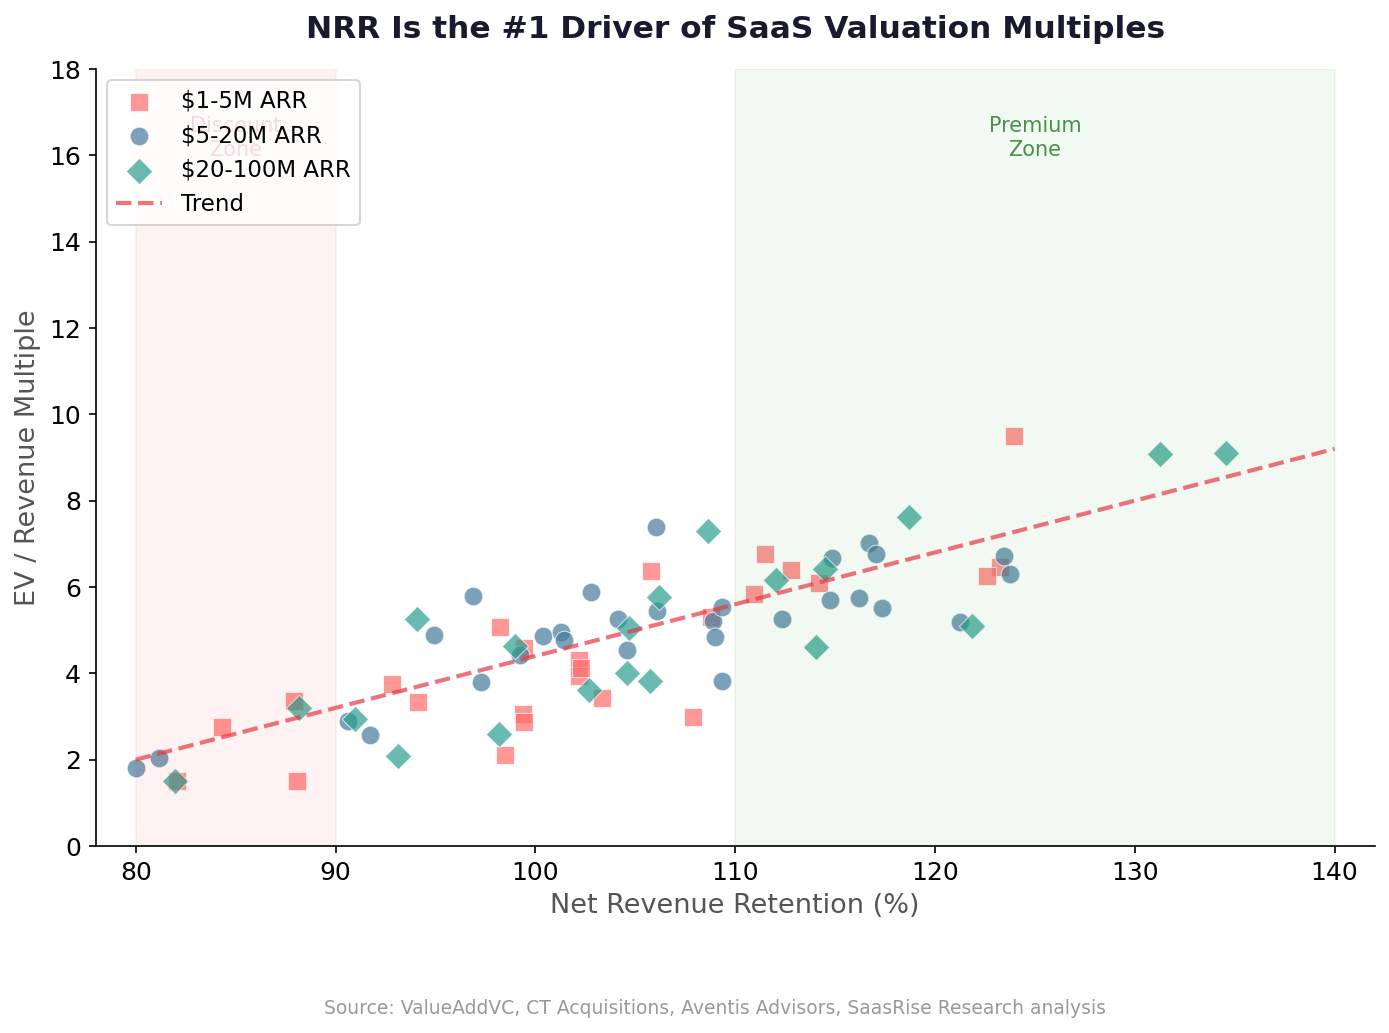
Figure 4: NRR is the strongest predictor of valuation multiple across all ARR tiers. Companies above 110% NRR consistently land in the premium zone.
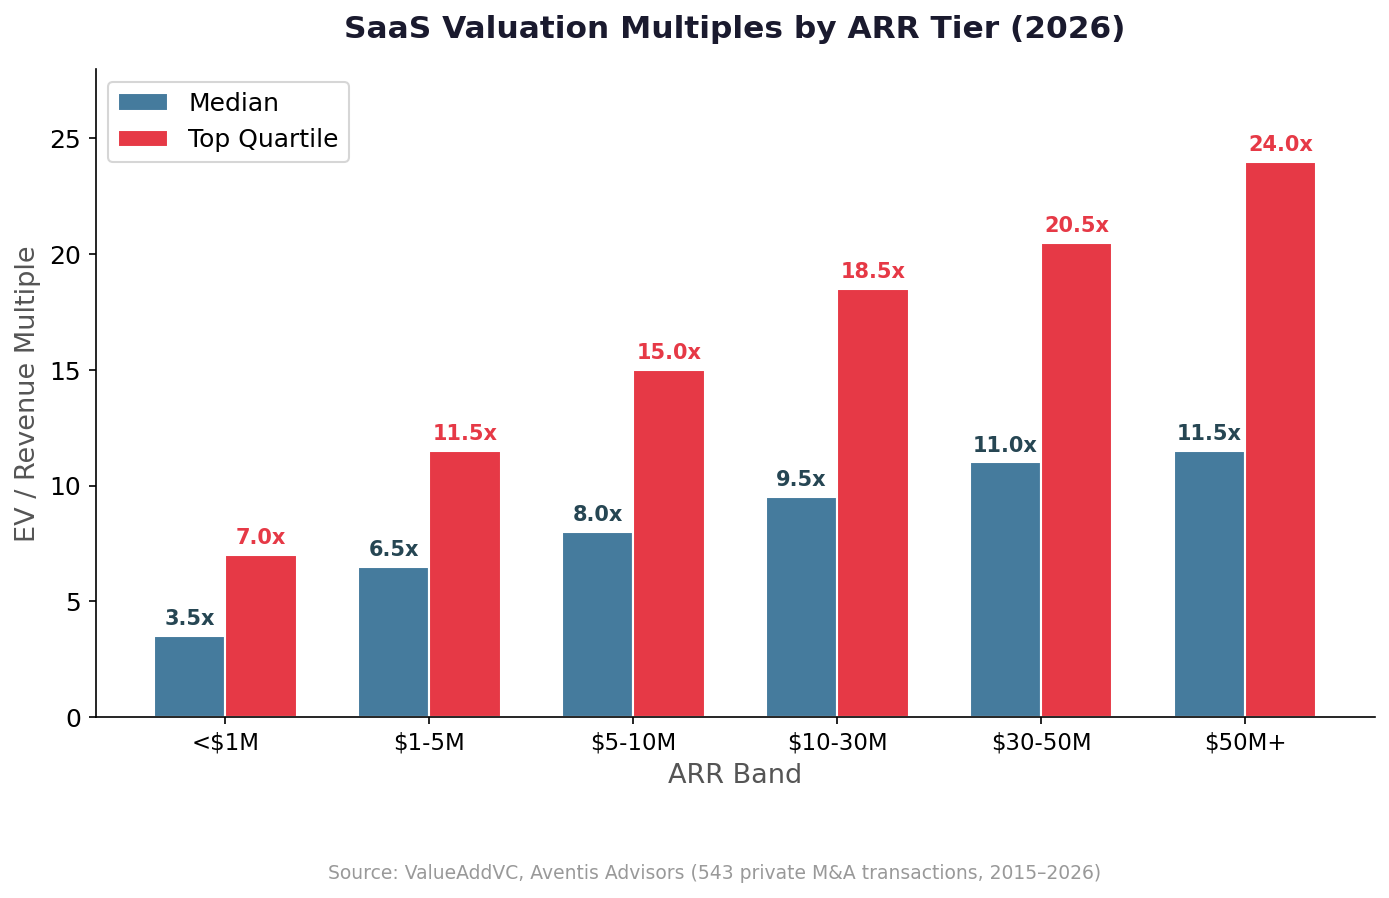
Figure 5: The gap between median and top-quartile multiples widens dramatically at every ARR band. Quality metrics compound the size premium.
Which Levers Move in 12 Months?
Not all metrics are equally movable in a 12-month preparation window. Pricing and expansion revenue (NRR drivers) can shift within 6–12 months through annual contract escalators, tiered pricing, and usage-based components. CAC payback can improve through channel optimization and sales process efficiency. However, structural GRR fixes — reducing churn caused by poor product-market fit in specific segments — typically require 18+ months. Customer concentration improvements also take time, as diversification requires new customer acquisition that dilutes the top-heavy mix.
| Metric | Discount Zone | Acceptable | Premium | Elite |
|---|---|---|---|---|
| ARR Growth | <20% | 20–30% | 30–50% | 50%+ |
| NRR | <90% | 90–110% | 110–120% | 120%+ |
| GRR | <80% | 80–85% | 85–95% | 95%+ |
| Gross Margin | <65% | 65–75% | 75–85% | 85%+ |
| CAC Payback | >24 months | 18–24 months | 12–18 months | <12 months |
| Monthly Logo Churn | >5% | 3–5% | 1–3% | <1% |
| Rule of 40 | <20 | 20–30 | 30–40 | 40+ |
| Customer Concentration | >30% | 20–30% | 10–20% | <10% |
Table 2: Metric Scorecard — Where Do You Stand? Source: CT Acquisitions, ValueAddVC, Aventis Advisors.
3. The 24-Month Exit Preparation Timeline
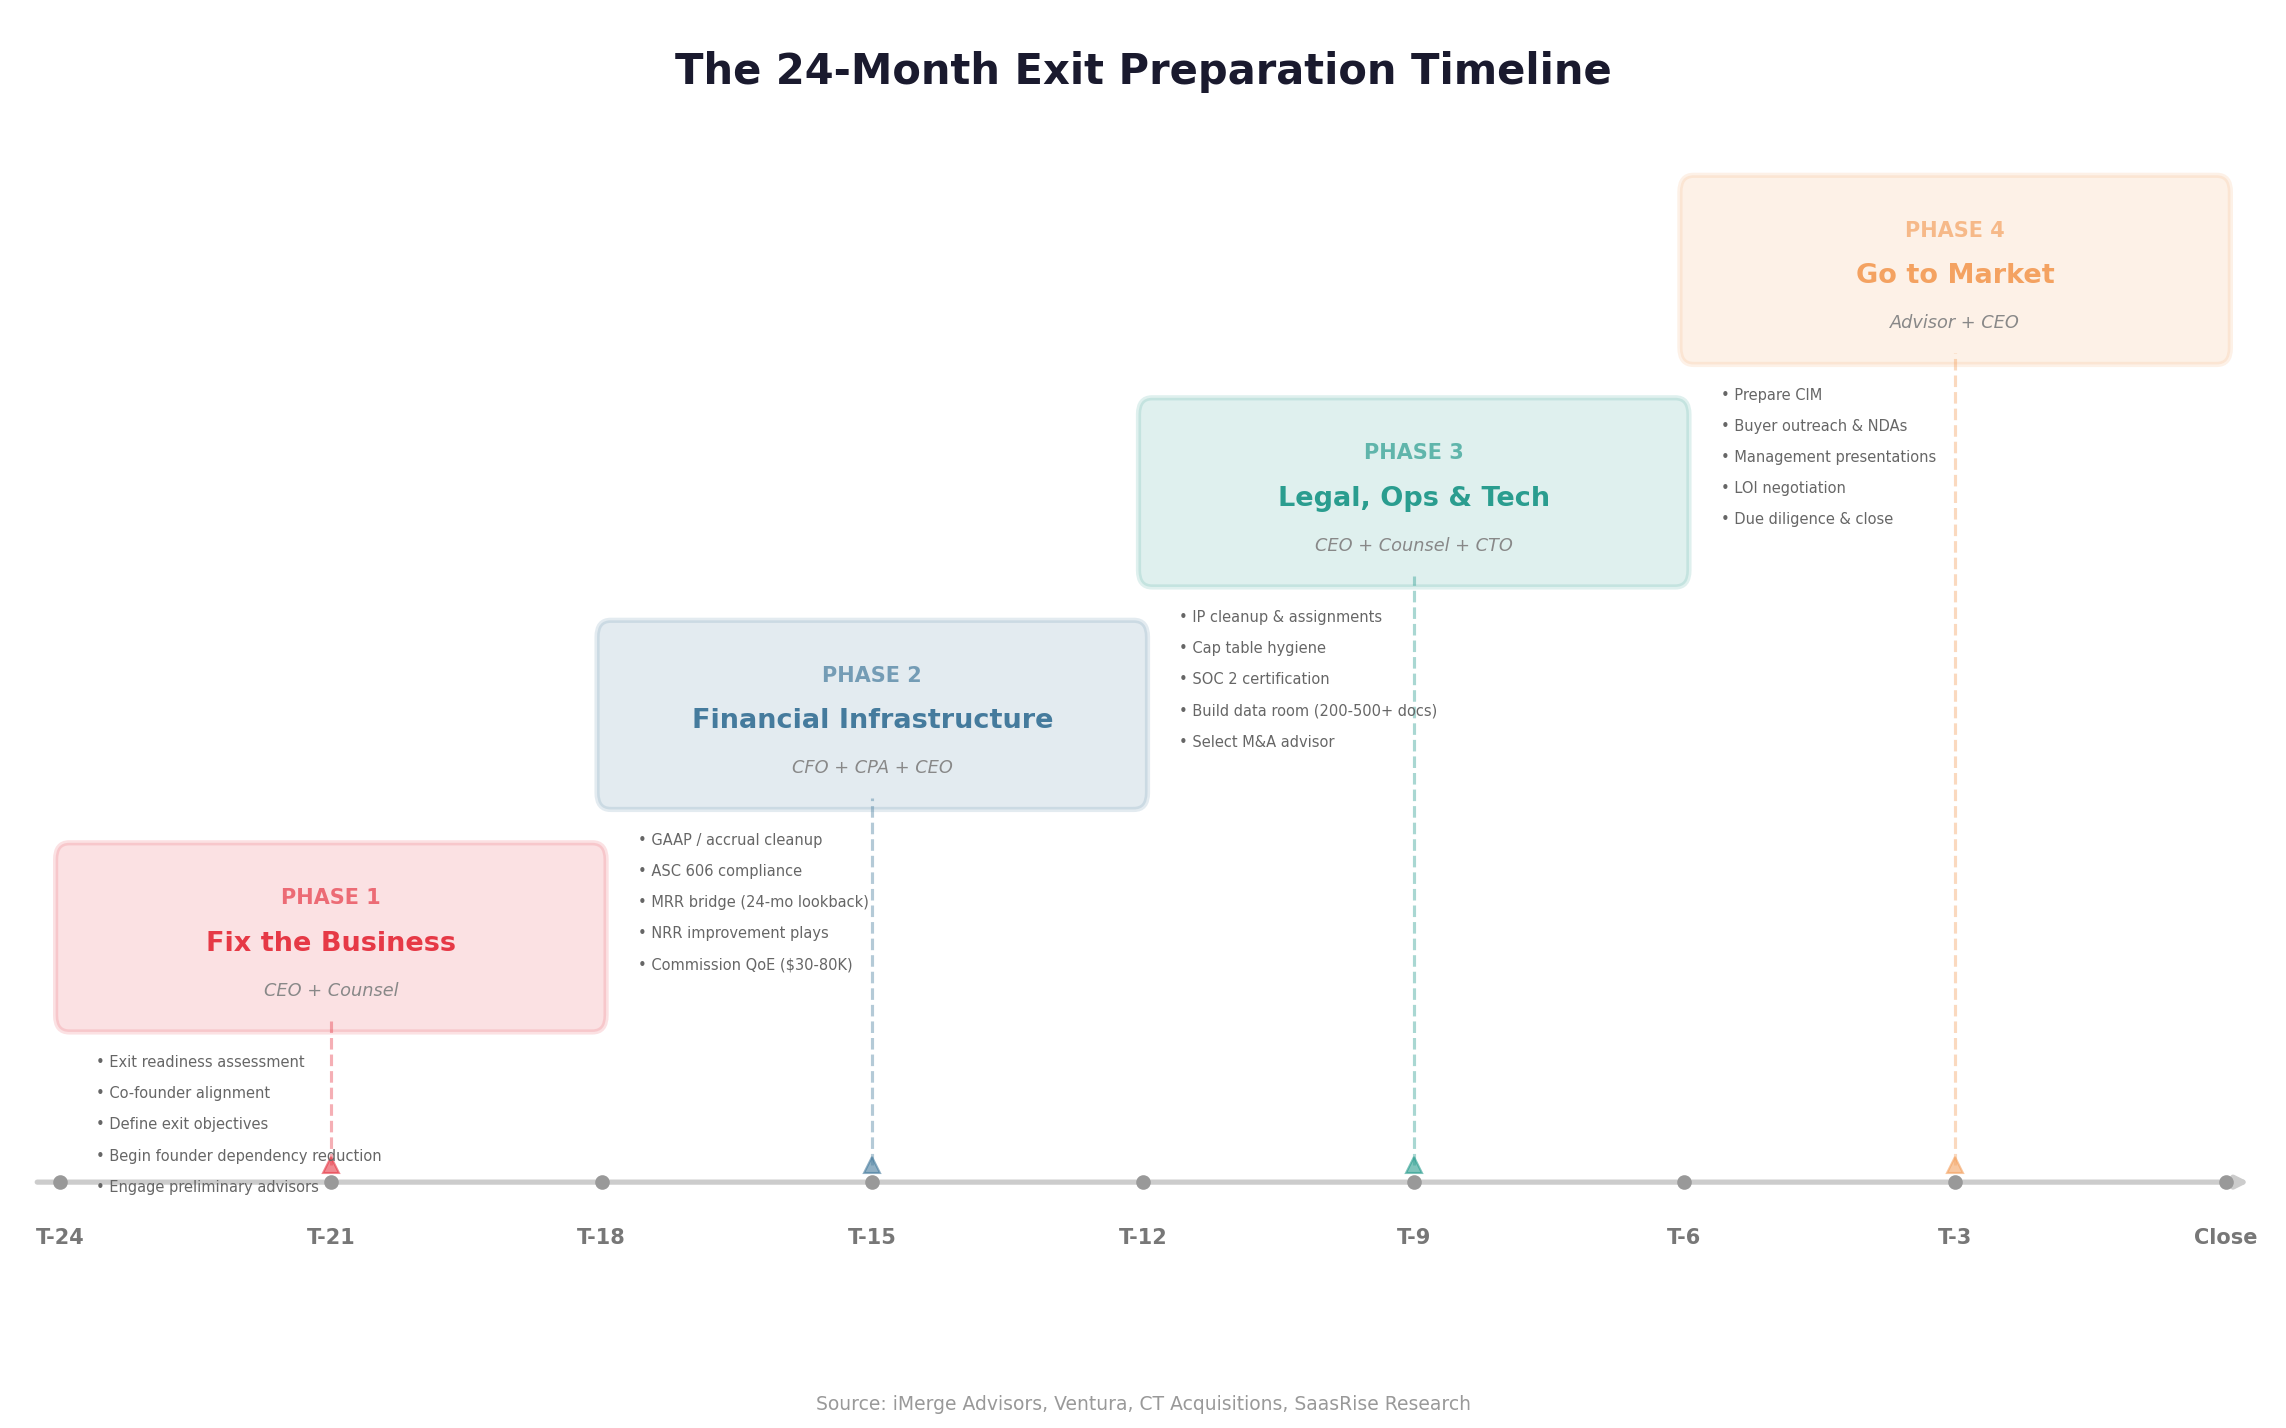
Exit preparation is not a single event — it is a structured program with distinct phases, each building on the last. Issues like messy financials, founder dependency, and structural churn problems take time to fix. Starting late means either delaying your exit or going to market with vulnerabilities that buyers will use to justify a lower price or retrade.
The following timeline breaks the preparation process into four phases with clear milestones and ownership assignments. Well-prepared founders who follow this playbook close in 6–9 months once they go to market. Unprepared founders spend 12–18 months in the process — and frequently accept worse terms due to deal fatigue.

Figure 6: The four-phase preparation timeline. Each phase has distinct objectives and ownership assignments.
Phase 1: Fix the Business (T-24 to T-18) — CEO + Counsel
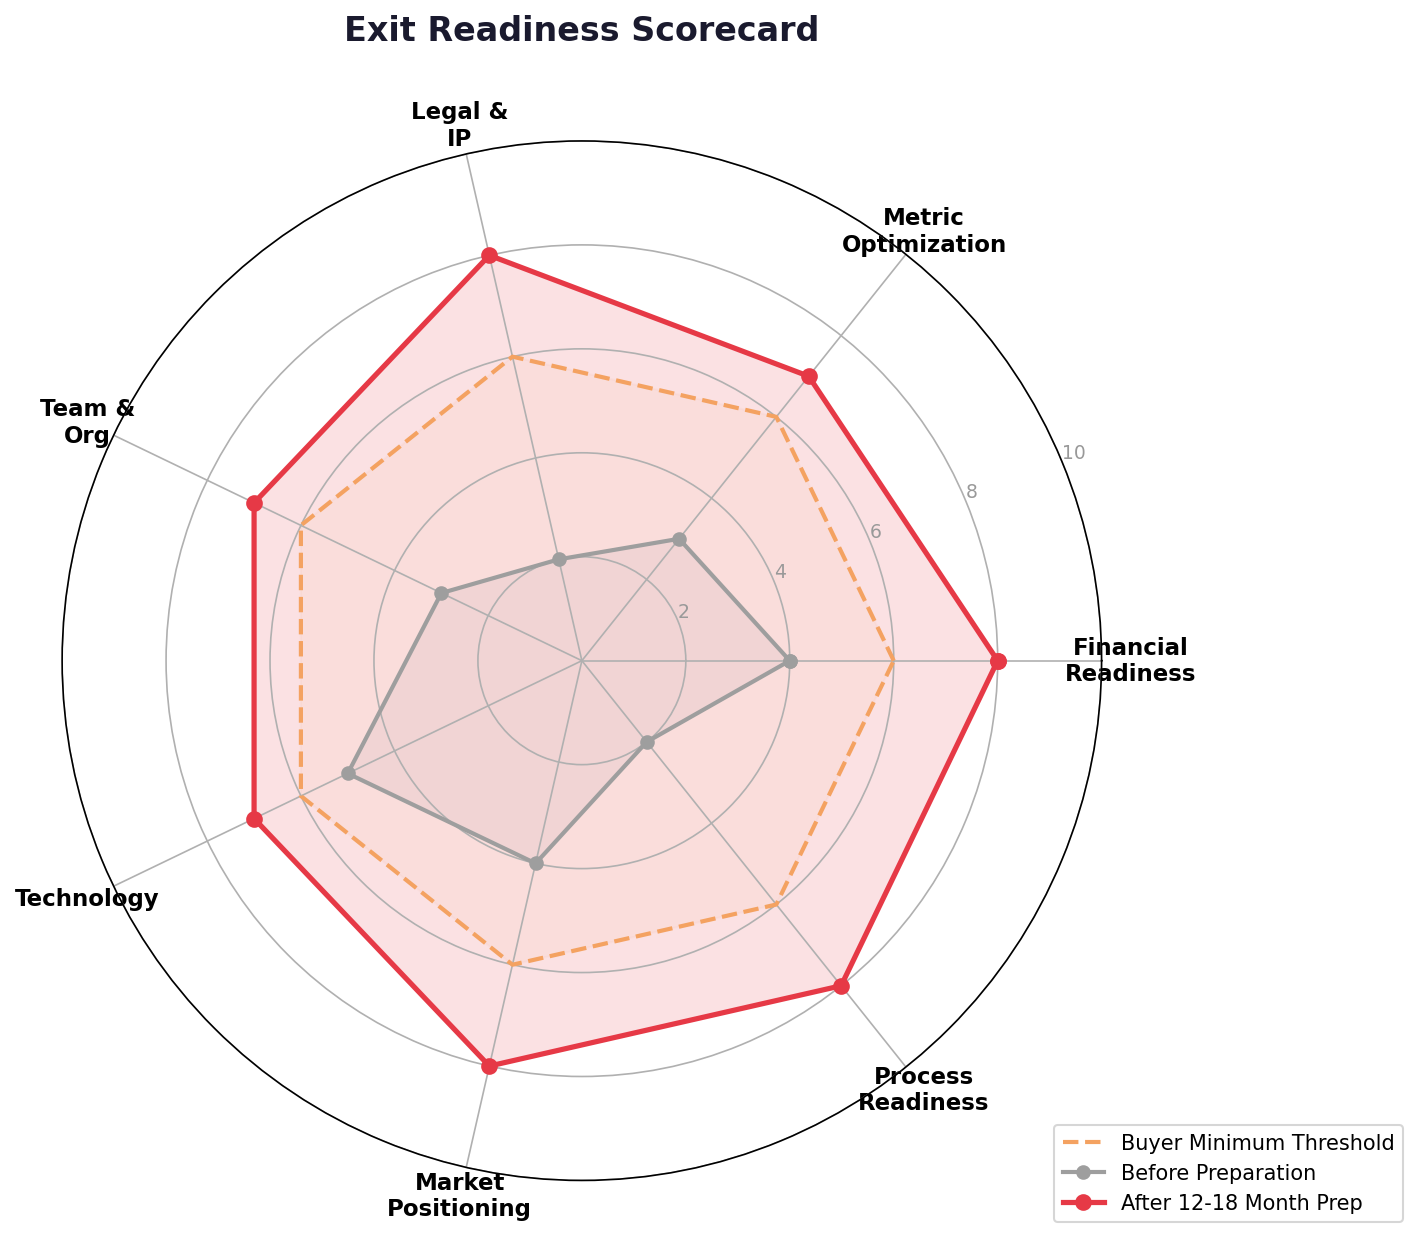
Conduct an honest exit readiness assessment across all dimensions: financials, metrics, legal, team, technology, and market positioning. Score yourself against the metric benchmarks in Section 2 and identify the biggest gaps. Have the co-founder alignment conversation early — misalignment discovered mid-process is a top-five deal killer. Discuss and document agreement on: target exit timeline, minimum acceptable price, post-close role expectations, and proceeds distribution. Define your exit objectives: full sale vs. recapitalization vs. growth partner. Identify target buyer types and begin building relationships informally. Engage a preliminary M&A attorney and tax advisor to understand deal structure implications. Begin the founder dependency reduction that will take 3–6 months to show measurable impact — this means hiring or promoting VP-level leaders who can own sales, product, and customer success independently.
Phase 2: Financial Infrastructure (T-18 to T-12) — CFO + CPA + CEO
Migrate to accrual accounting if not already done. Implement monthly close discipline with closes completed within 15 days of month-end. Achieve ASC 606 revenue recognition compliance — this is non-negotiable, and getting it wrong will reduce your reported revenue by 10–15% when the buyer’s team recalculates. Build your MRR bridge with a 24-month lookback showing new, expansion, contraction, and churn for every month. Begin executing NRR improvement plays (detailed in Section 4) — the sooner you start, the more quarters of improved NRR data buyers will see. Convert month-to-month customers to annual contracts with the goal of having 60%+ of ARR on annual terms before going to market. Annual contracts signal revenue durability and improve gross retention metrics. Separate owner compensation and one-time expenses from operating expenses. Commission your sell-side Quality of Earnings analysis ($30–80K), which takes 4–6 weeks but accelerates the entire back-end close by 30–60 days.
Phase 3: Legal, Ops & Tech Readiness (T-12 to T-6) — CEO + Counsel + CTO
Execute IP cleanup and ensure signed assignment agreements cover every founder, every employee, and every contractor who has ever contributed to the codebase. This is the single most common legal deal killer, and a $5–10K pre-emptive IP review now can prevent a $50M deal from dying in diligence later. Clean up the cap table — resolve any unexercised options, outstanding convertible notes, or ambiguity about ownership percentages. Audit all customer contracts for change-of-control clauses that could allow customers to terminate upon acquisition; where possible, proactively renegotiate these terms. Begin or complete SOC 2 Type II certification — the vast majority of deal teams now expect cybersecurity scrutiny, and not having SOC 2 will either delay the deal or reduce the multiple. Prepare your technology for due diligence by improving documentation, distributing critical knowledge, and addressing known security vulnerabilities. Build the data room with 200–500+ documents organized by category (corporate, IP, contracts, employment, compliance, financial, litigation). Select your M&A advisor using the criteria outlined in Section 6.
Phase 4: Go to Market (T-6 to T-0) — Advisor + CEO
Prepare the Confidential Information Memorandum (CIM) — a 30–50 page document that presents your company’s story, performance, and opportunity in the most favorable truthful light. Execute buyer outreach under NDA to 30–60 potential acquirers. Conduct management presentations with the 8–12 most interested parties. Navigate Letters of Intent (pay close attention to exclusivity periods — never agree to more than 60 days), confirmatory due diligence (4–12 weeks depending on deal complexity), purchase agreement negotiation (representations, warranties, indemnification, working capital mechanisms), and closing mechanics. Throughout this phase, the most important thing you can do is keep running the business — revenue declines during the sale process are the fastest way to trigger a retrade or kill a deal.
| Quarter | Key Milestones | Owner | Success Criteria |
|---|---|---|---|
| Q1 (T-24 to T-21) | Exit readiness assessment; co-founder alignment | CEO | Gaps identified, objectives defined |
| Q2 (T-21 to T-18) | Engage tax advisor; begin founder dependency plan | CEO + Counsel | Management hires initiated |
| Q3 (T-18 to T-15) | GAAP migration; monthly close process; NRR plays launched | CFO | Clean monthly closes within 15 days |
| Q4 (T-15 to T-12) | MRR bridge built; annual contract push; QoE commissioned | CFO + CEO | MRR reconciles to GL within 5% |
| Q5 (T-12 to T-9) | IP assignments; cap table cleanup; SOC 2 started | Counsel + CTO | All assignments signed; SOC 2 in progress |
| Q6 (T-9 to T-6) | Data room built; advisor selected; contract audit complete | CEO + Counsel | Data room 80%+ complete; advisor engaged |
| Q7 (T-6 to T-3) | CIM prepared; buyer outreach; management presentations | Advisor + CEO | Multiple LOIs received |
| Q8 (T-3 to Close) | Due diligence; purchase agreement; close | Advisor + Counsel | Deal closed at target terms |
Table 3: Quarter-by-Quarter Milestone Checklist with Owner Assignments.
4. Financial Cleanup & the NRR Plays
Getting Your Books Diligence-Ready
Revenue recognition is where most financial preparation begins and where many deals encounter their first friction. Under ASC 606, revenue must be recognized when performance obligations are satisfied — not when cash is collected, not when the contract is signed, and not when the billing system generates an invoice.
The most common mistakes that trigger diligence findings:
- Annual contracts booked upfront: If you collected $120K on January 1 for a 12-month contract, your January revenue is $10K, not $120K. Recognition must be ratably spread over the service period.
- Implementation fees recognized at signing: If implementation is not a distinct performance obligation (it usually is not for SaaS), those fees must be spread over the contract term.
- Usage-based revenue recognized at billing: Revenue should be recognized when usage occurs, not when billed.
- Multi-element arrangements: Bundled deals with software, services, and support need standalone selling prices allocated to each element.
The #1 Credibility Killer: MRR that does not reconcile with bank statements. If an investor’s analyst cannot reconcile your MRR to your GAAP revenue within 5% variance, you have a credibility problem that no explanation fixes. Build your MRR bridge — new, expansion, contraction, churn — going back 24 months and reconcile it to the general ledger before any buyer sees it.
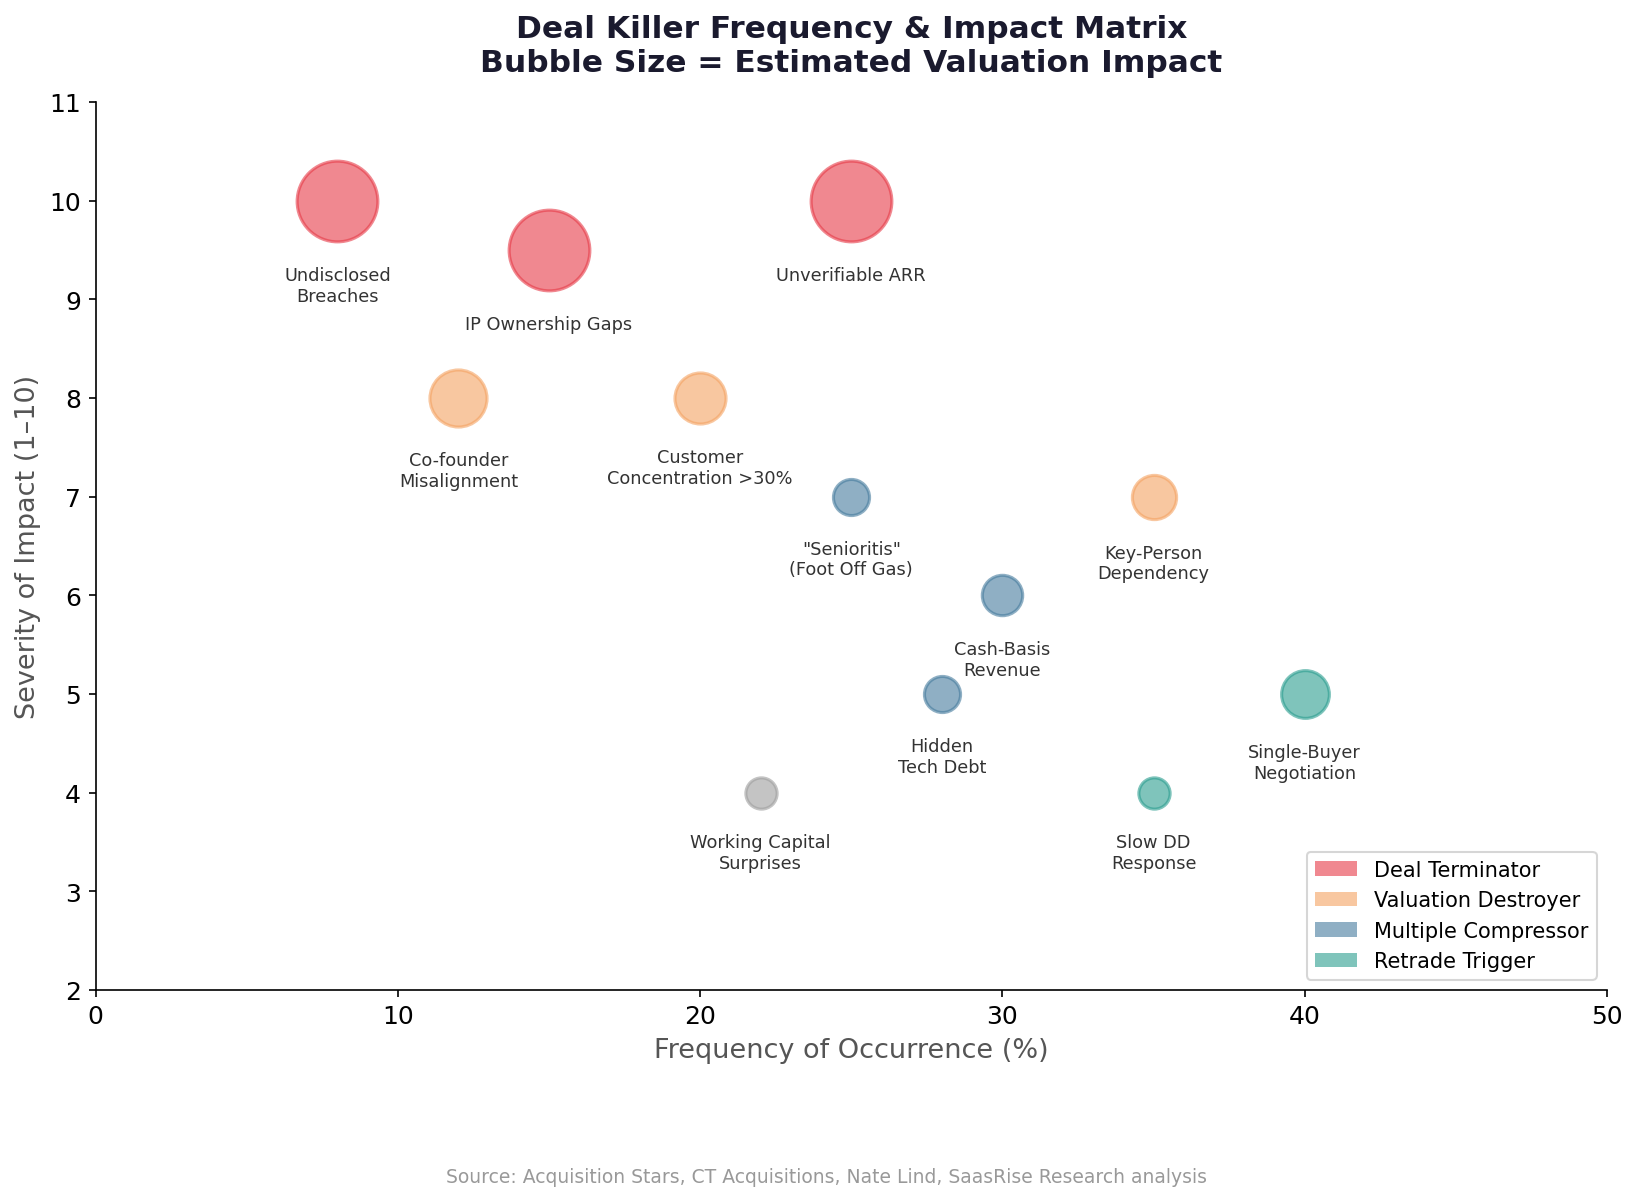
Figure 7: How buyers reconstruct your ARR. Every component must be verifiable against contracts and bank statements.
The Quality of Earnings Analysis
A Quality of Earnings (QoE) report is a forensic financial analysis that normalizes your financials for items that distort run-rate EBITDA. The output is a “normalized EBITDA” number that the buyer uses to apply their multiple. It costs $30K–$80K and typically runs 4–6 weeks. While this may seem expensive for a pre-sale exercise, it is effectively required by lenders for deals above $3M SDE, and getting it done first puts you in control of the narrative.
Sellers with a sell-side QoE close 1–2 weeks faster and experience significantly fewer retrades, because the buyer’s diligence team validates your numbers rather than discovering surprises. The QoE accelerates the back-end close timeline by 30–60 days. Without a sell-side QoE, the buyer’s team will conduct their own analysis — and their incentive is to find reasons to adjust your normalized EBITDA downward, creating retrade ammunition at the moment when you have the least negotiating leverage.
Six critical items drive 40% of all QoE findings:
- Working capital normalizations: The QoE analyzes working capital across multiple periods to establish a defensible target for the closing balance sheet. Seasonality, customer prepayments, and deferred revenue treatment are the most common adjustment areas.
- Customer concentration: The QoE quantifies concentration risk (top 10 customers by revenue), churn history, contract length, and revenue stability — all of which factor into the buyer’s investment committee decision.
- Revenue recognition: For SaaS companies, recognition methodology can swing reported revenue 10–15%. The QoE confirms methodology is GAAP-compliant and defensible.
- EBITDA add-backs: Owner compensation, one-time expenses, non-recurring items, and related-party transactions. Each add-back must be documented and defensible — aggressive add-backs that cannot be justified erode credibility.
- Accounts receivable aging: AR that is aging beyond 90 days signals collection issues that reduce the effective value of reported revenue.
- Deferred revenue treatment: How prepaid contracts are recognized and whether the deferred revenue balance is growing or shrinking as a percentage of total revenue.
The Five NRR Improvement Plays
NRR is the single most important valuation driver, and it is improvable within 6–12 months. These five plays, executed in parallel, can lift NRR by 10–20 percentage points before you go to market:
- Annual contracts with built-in pricing escalators (3–7% annual): This converts every contract renewal into automatic expansion revenue. A 5% annual escalator across 70% of your base compounds NRR improvement without any new product features.
- Tiered pricing with upsell paths (Starter → Pro → Enterprise): Customers naturally migrate up tiers over time, creating expansion revenue that flows directly to NRR.
- Usage-based components (per-seat, per-API call, per-GB): As customers grow, their usage grows, and your revenue grows with it. This is the most sustainable form of NRR improvement.
- Expansion selling motions: Dedicate an expansion AE or build a structured quarterly business review (QBR) program that surfaces upsell opportunities. Companies with formal expansion programs achieve 15–20% higher NRR than those without.
- Proactive churn prevention: Implement customer health scoring, automated intervention triggers, and CSM playbooks. Reducing gross churn by 2–3 percentage points has the same NRR impact as adding 2–3 points of expansion.

Figure 8: How NRR compounds into enterprise value over 3 years. The difference between 95% and 130% NRR is not incremental — it is transformational.
Preparing for Your Exit?
SaasRise members get access to M&A prep workshops, banker introductions, and a network of 400+ SaaS CEOs who have been through the process.