
This 2026 SaaS Benchmarks Report synthesizes data from 2,500 private and public SaaS companies across 15+ industry surveys and datasets to deliver definitive 2026 benchmarks for revenue growth, NRR, churn, net profit, gross margin, the Rule of 40, S&M spend, R&D spend, compensation, and payback windows. Every metric is segmented by company size (SMB, mid-market, enterprise), AI classification (AI-native, AI-embedded, legacy), vertical vs. horizontal orientation, and SaaS subcategory — giving you the most complete picture available of where the industry stands today and where it’s heading.
We hope it’s helpful in knowing where your SaaS company stacks up. Feel free to forward it to your CFO.
This report is published by SaasRise, the #1 mastermind community for SaaS CEOs and Founders with $1M–$100M+ in ARR. Members have collectively raised $1B+ and have $3B+ in ARR.
📋 Table of Contents
- The SaaS Founder Target Benchmarks for 2026
- Revenue Growth Benchmarks by Segment
- Annual Net Revenue Retention (Annual NRR) Benchmarks
- Account & Revenue Churn Benchmarks
- Net Profit & Margin Benchmarks
- Rule of 40 Benchmarks
- AI-Native vs. AI-Embedded vs. Legacy SaaS
- Vertical SaaS vs. Horizontal SaaS
- Benchmarks by SaaS Subcategory
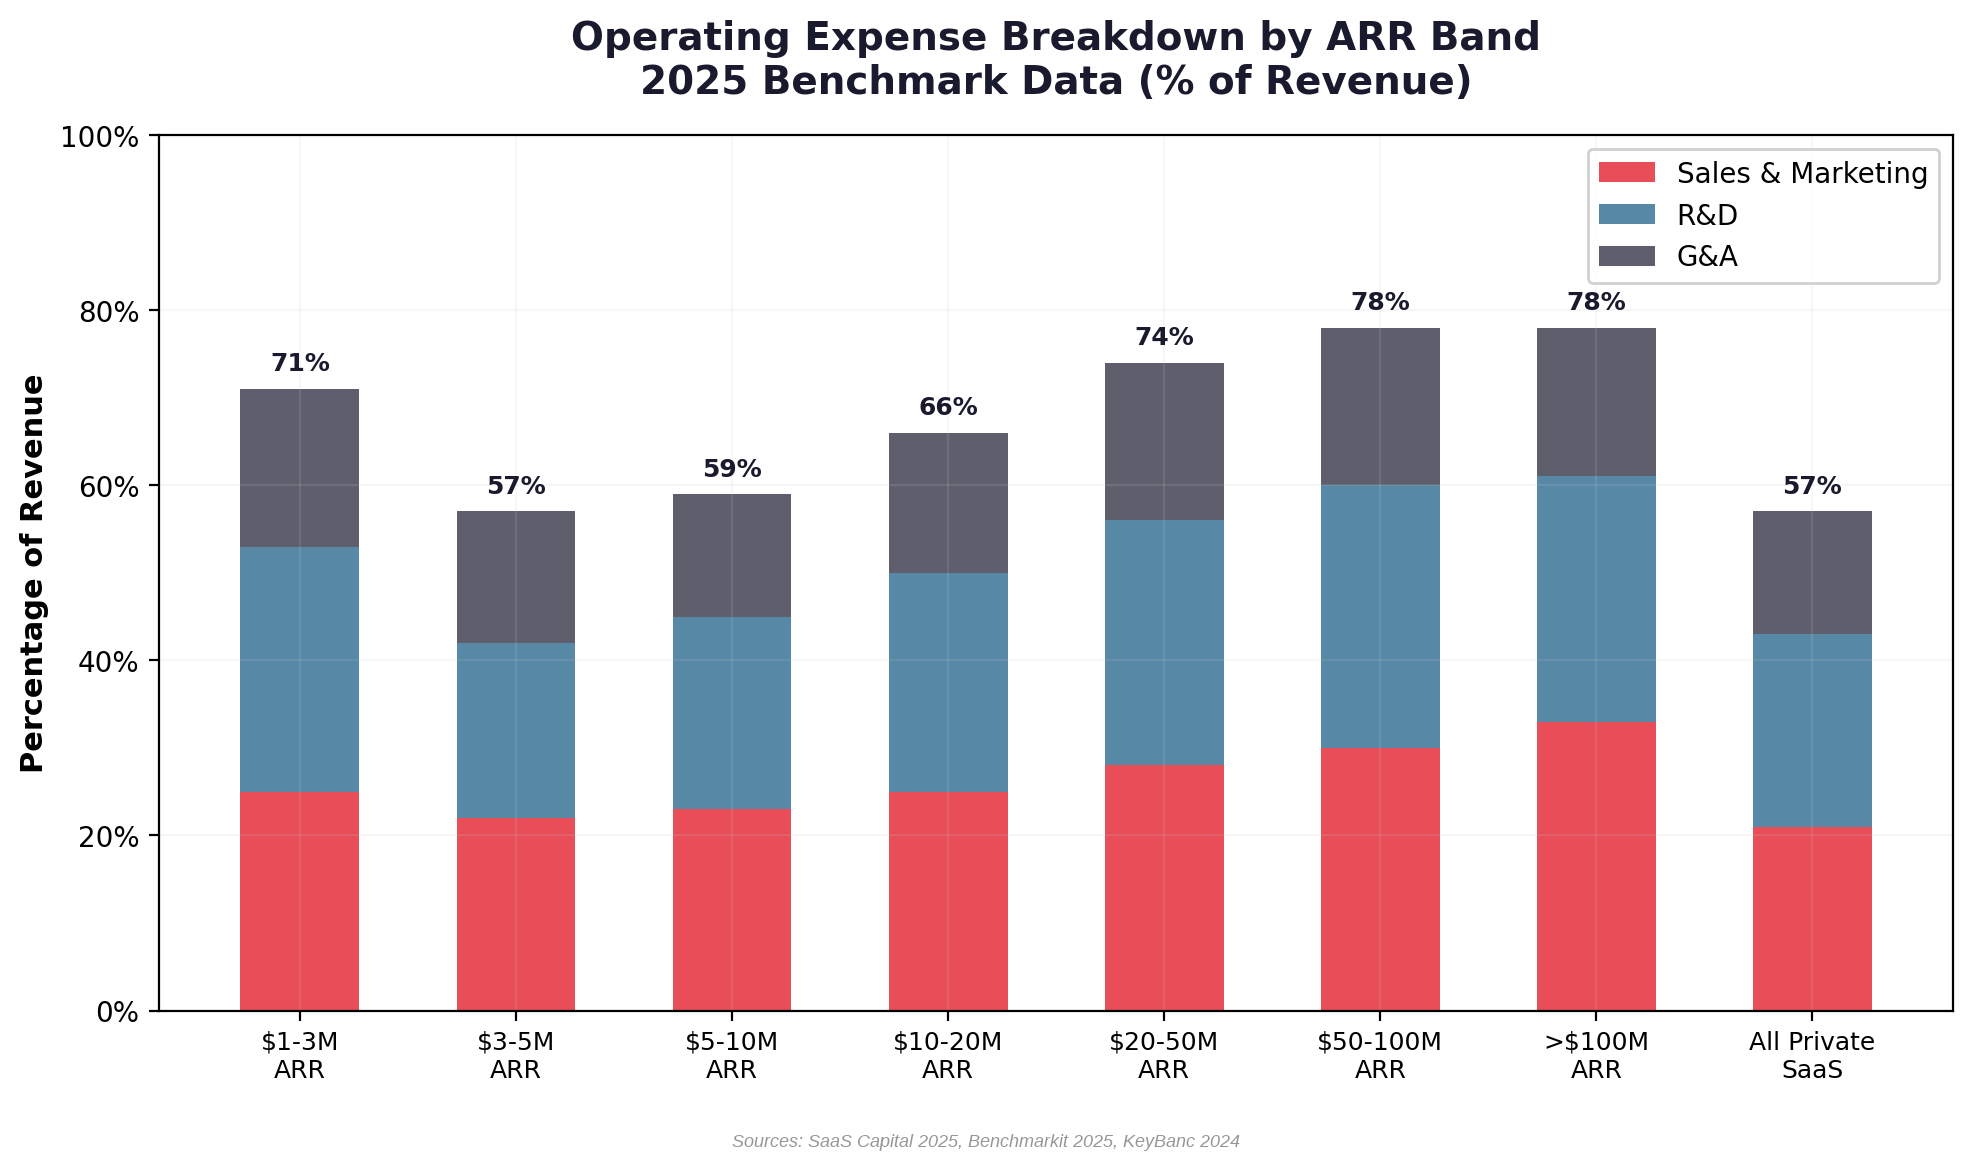
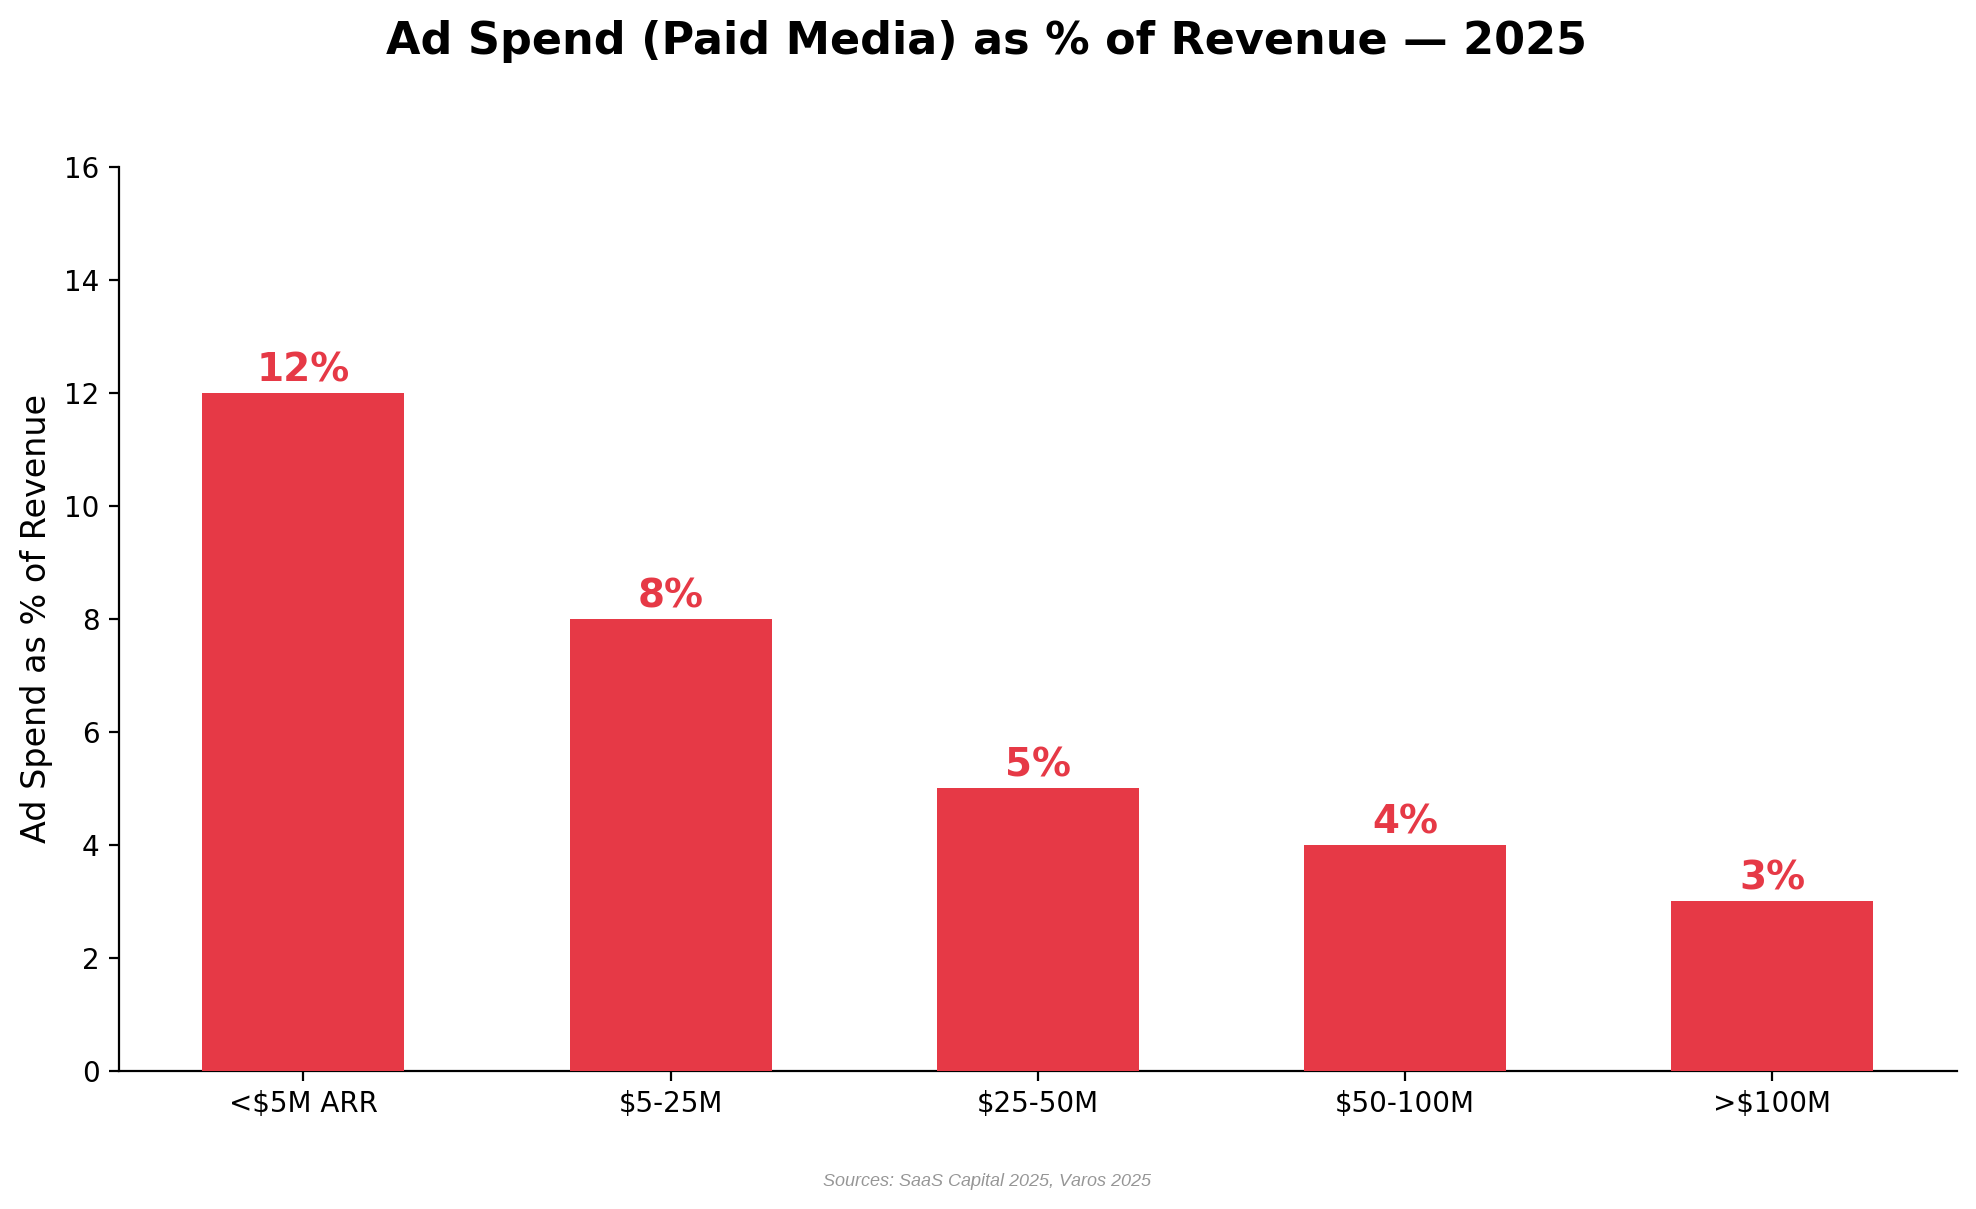
- Spending & OpEx Benchmarks (S&M, R&D, G&A, Ad Spend)
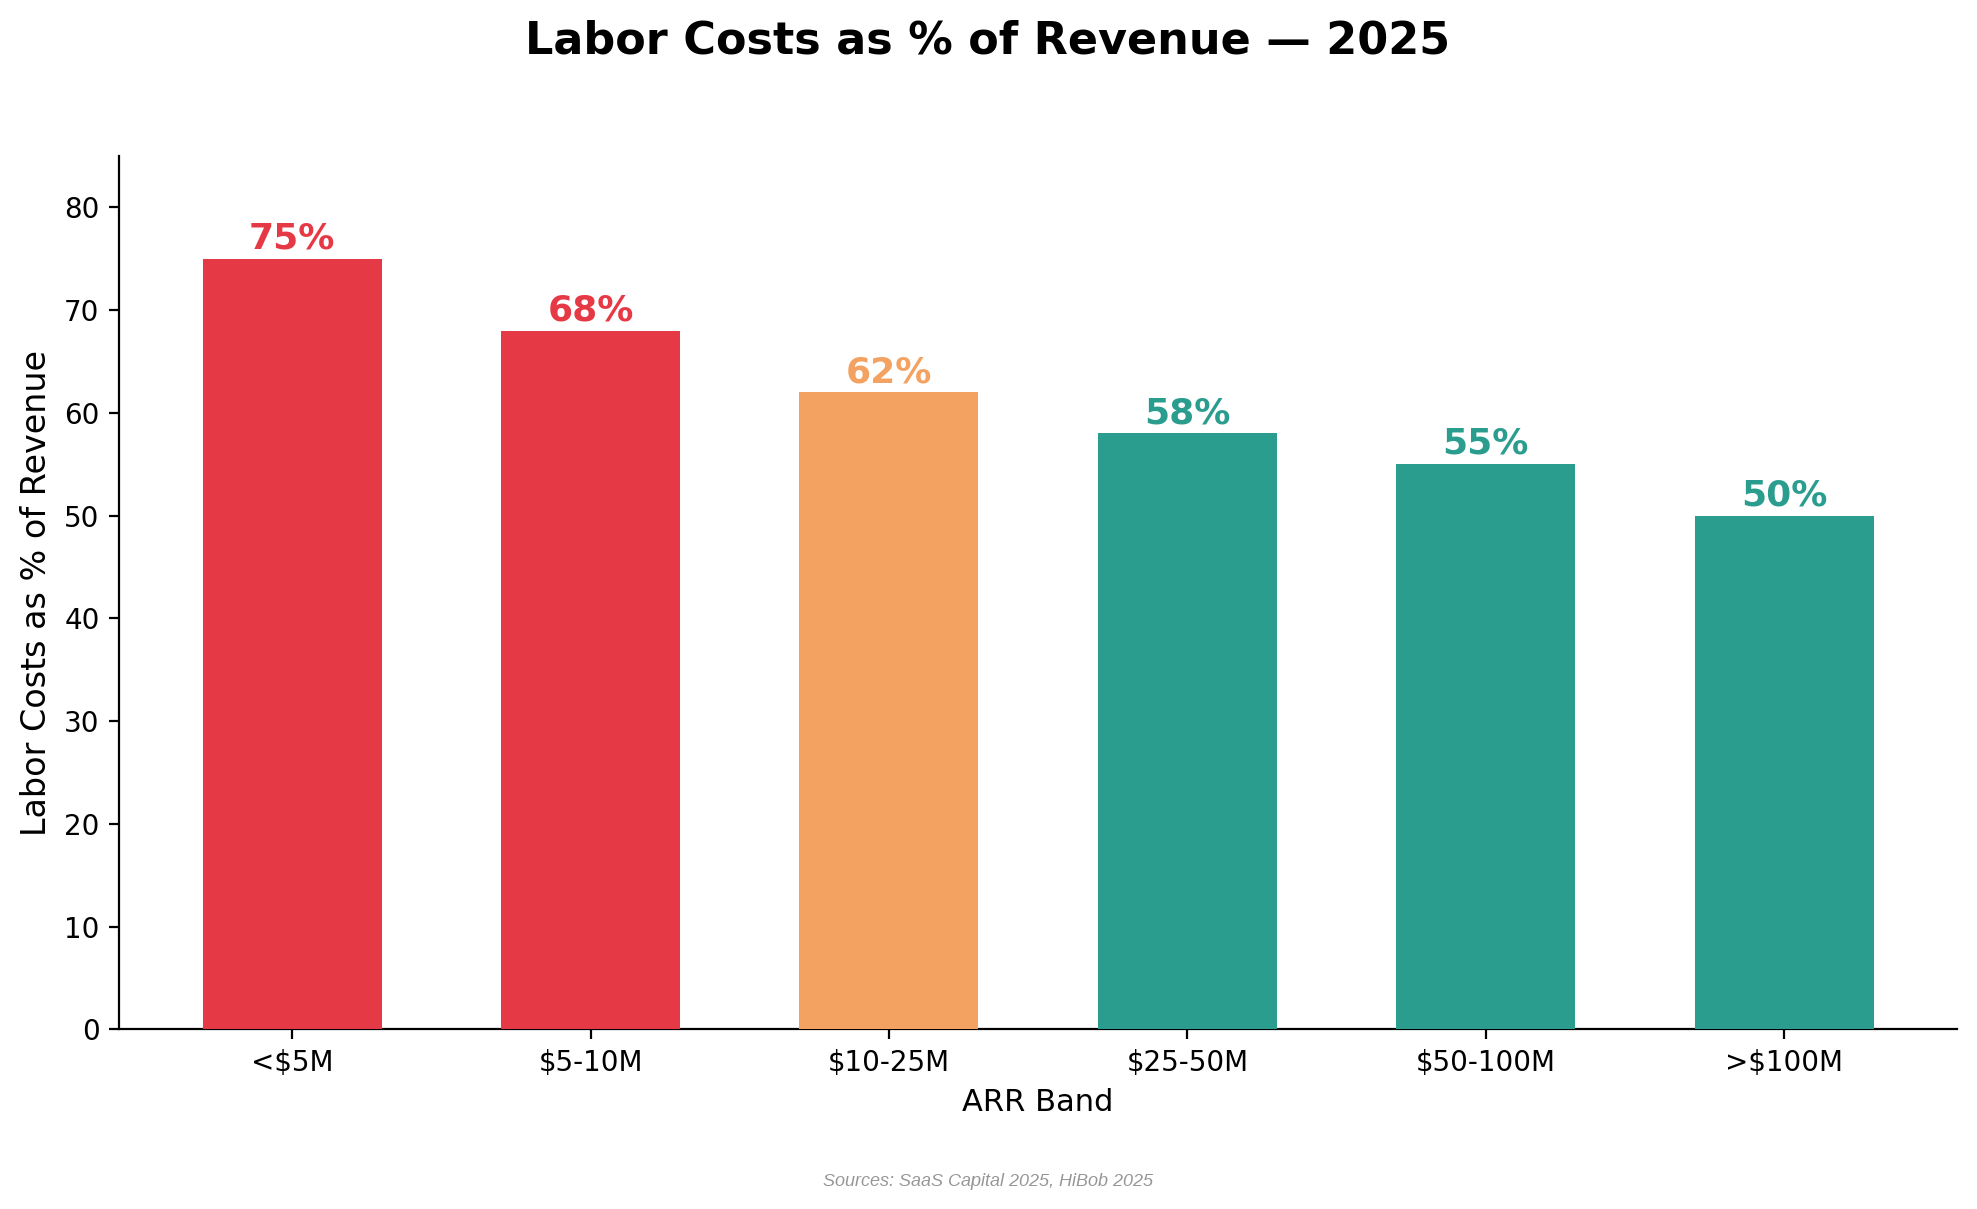
- Labor Costs, Gross Margin & Revenue per Employee
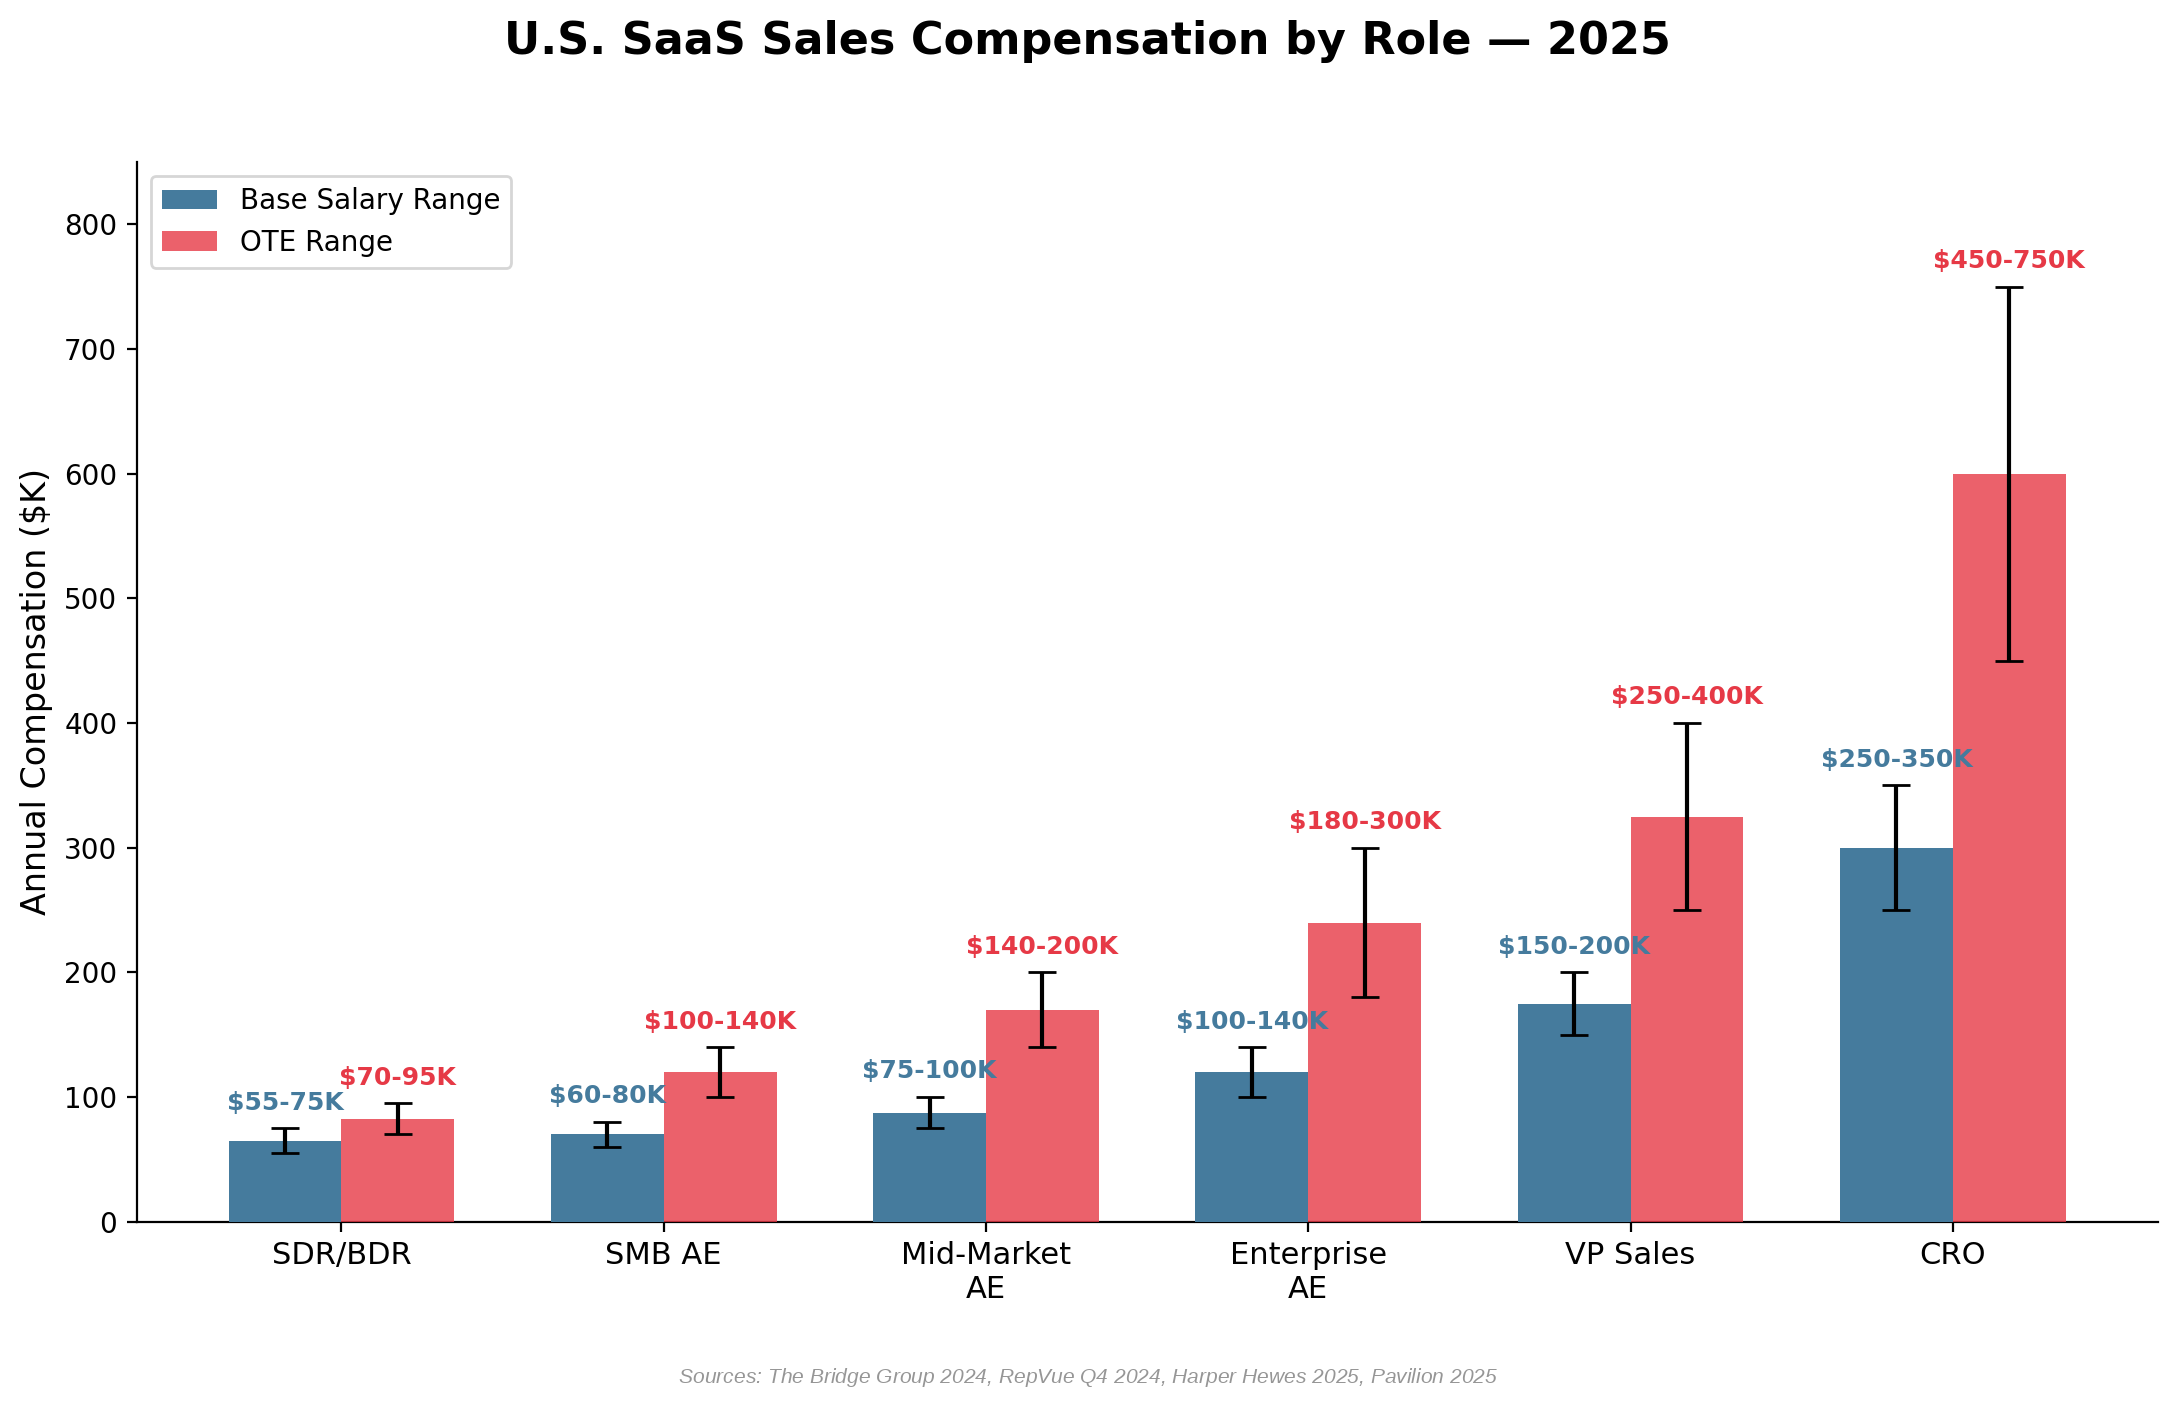
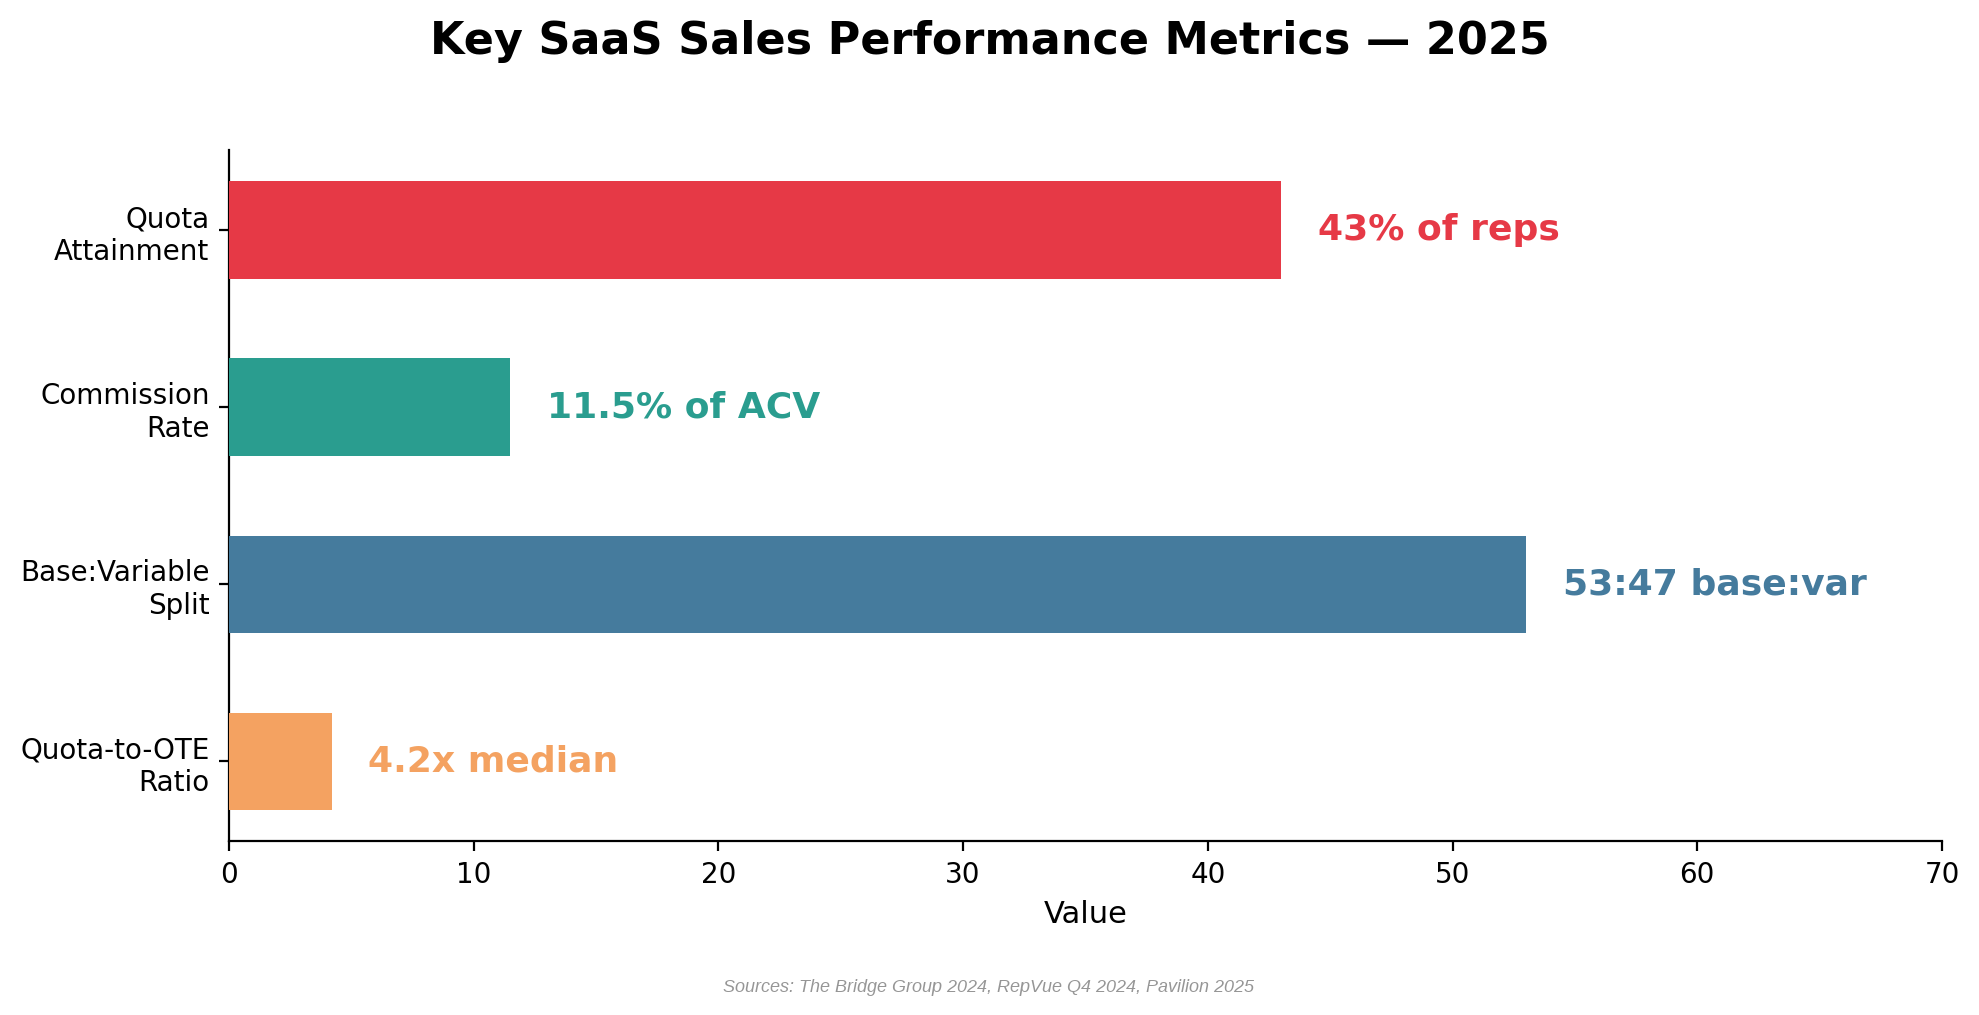
- SaaS Sales Compensation Benchmarks
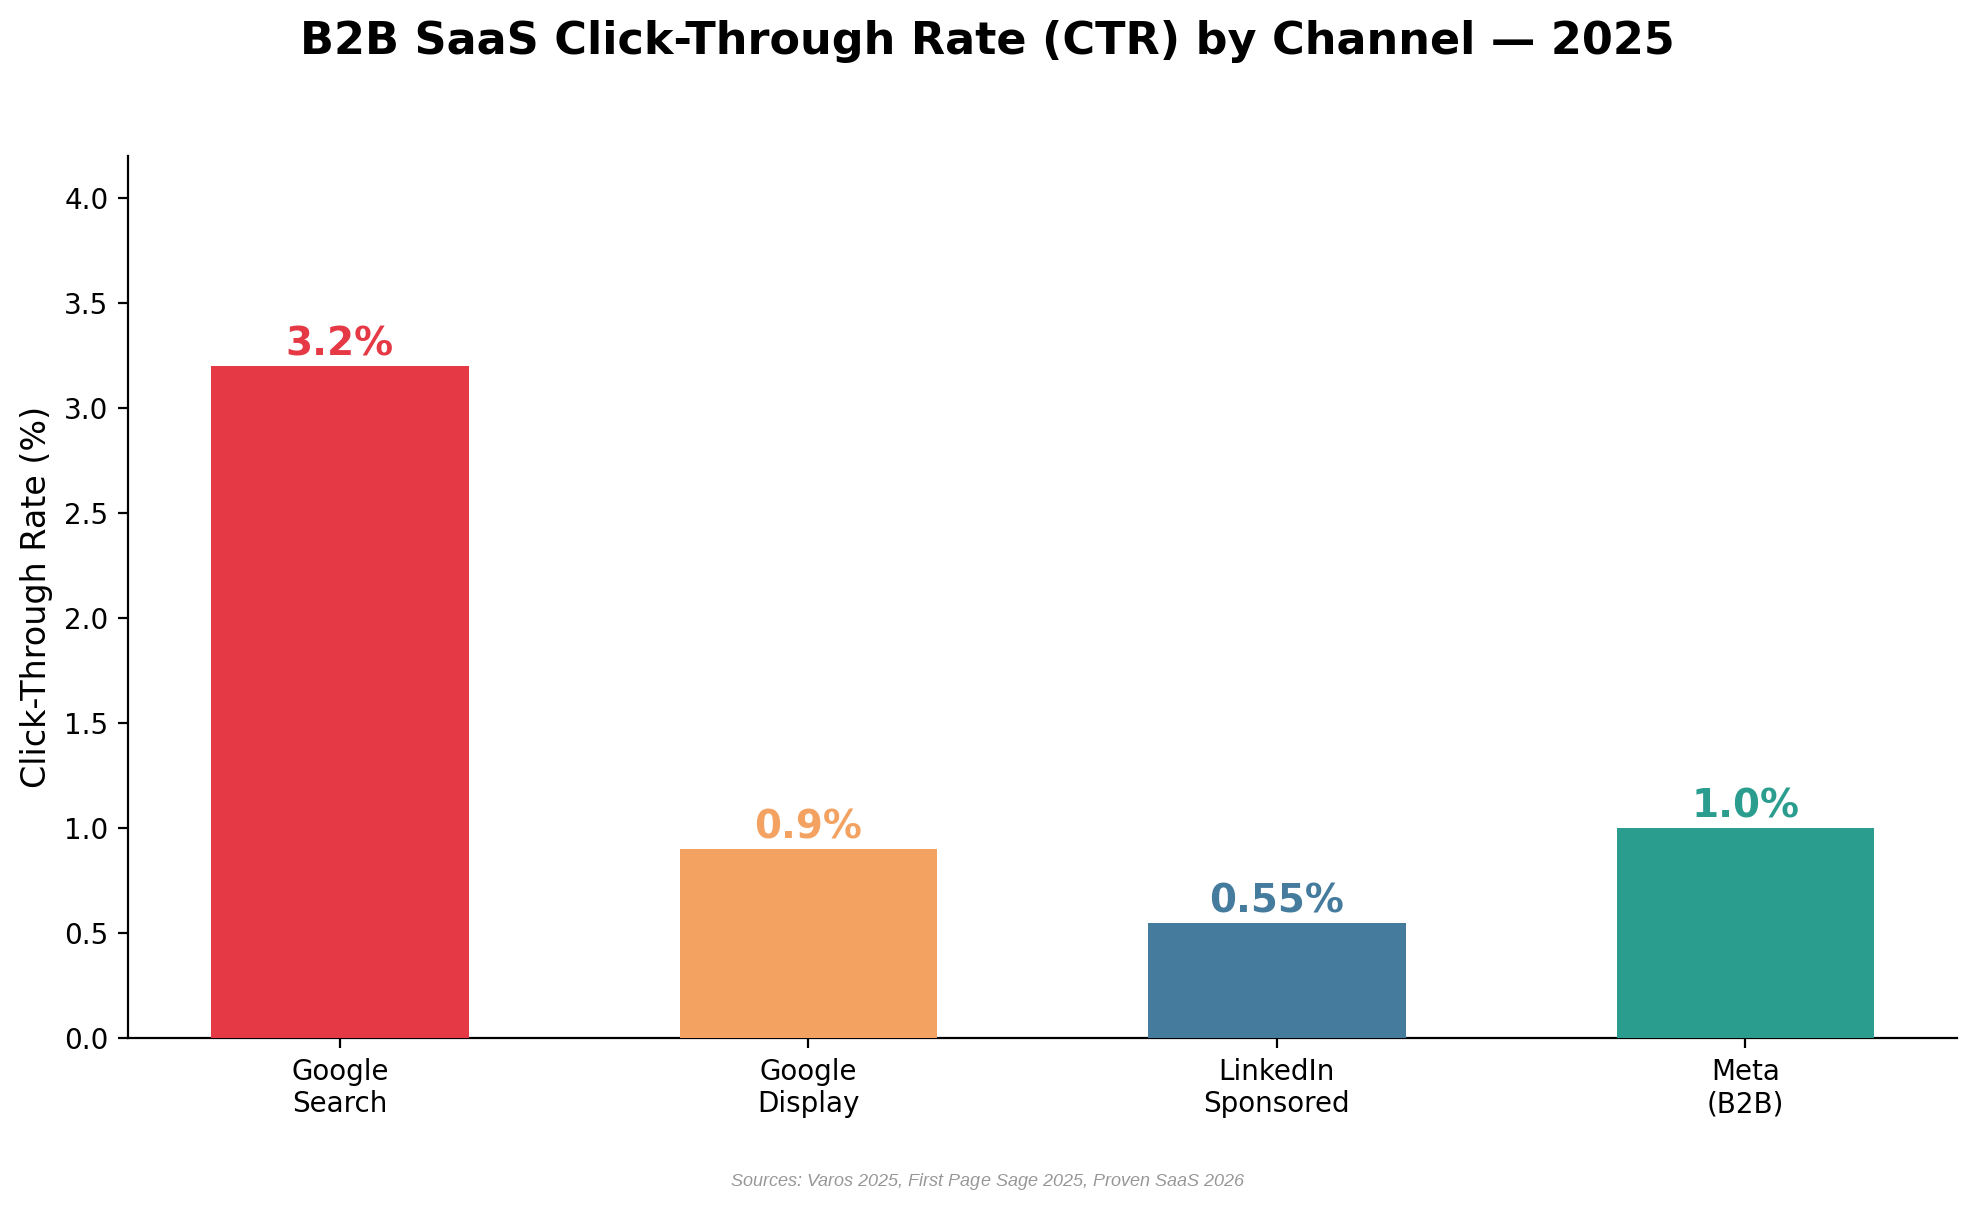
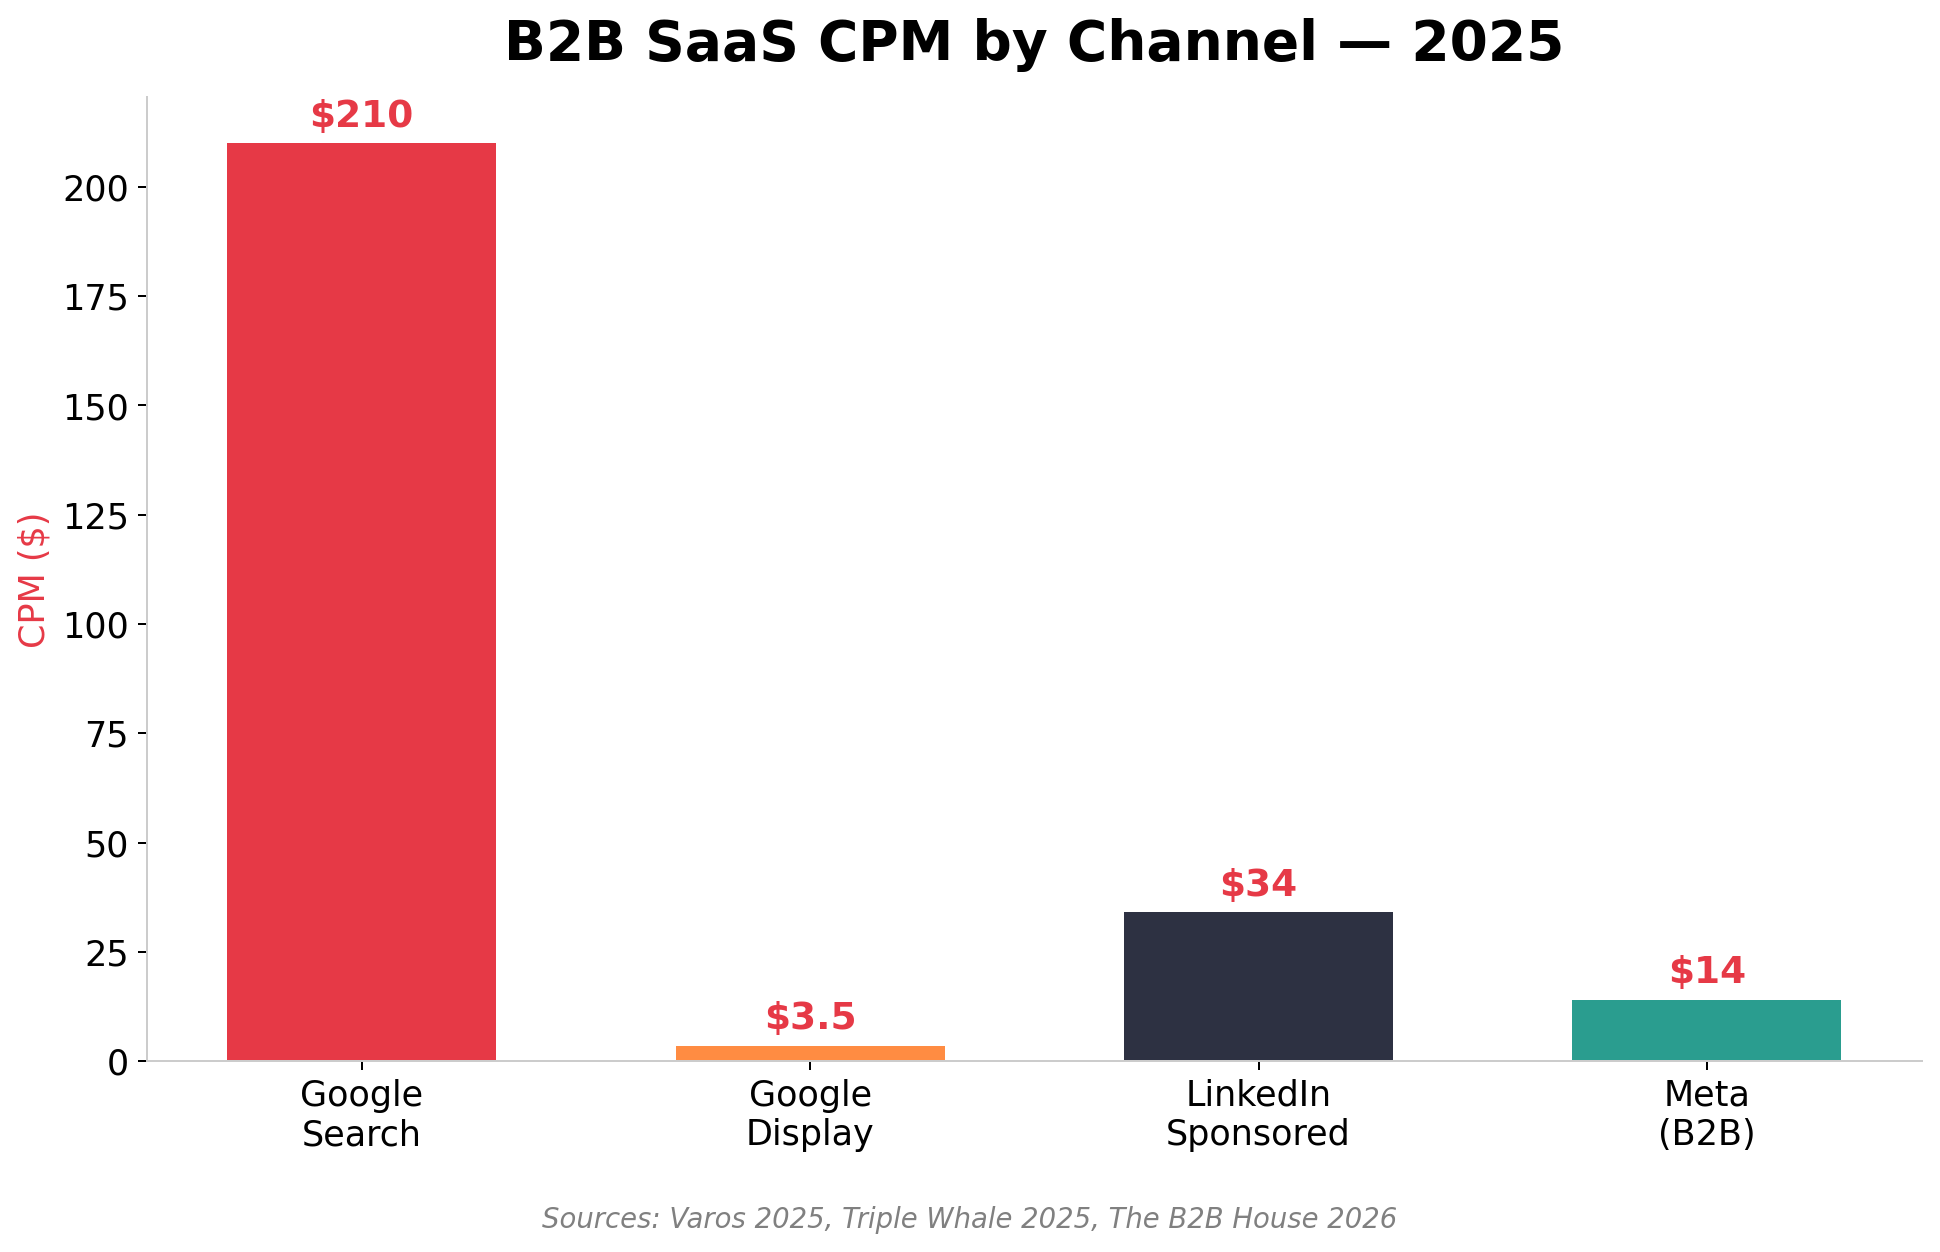
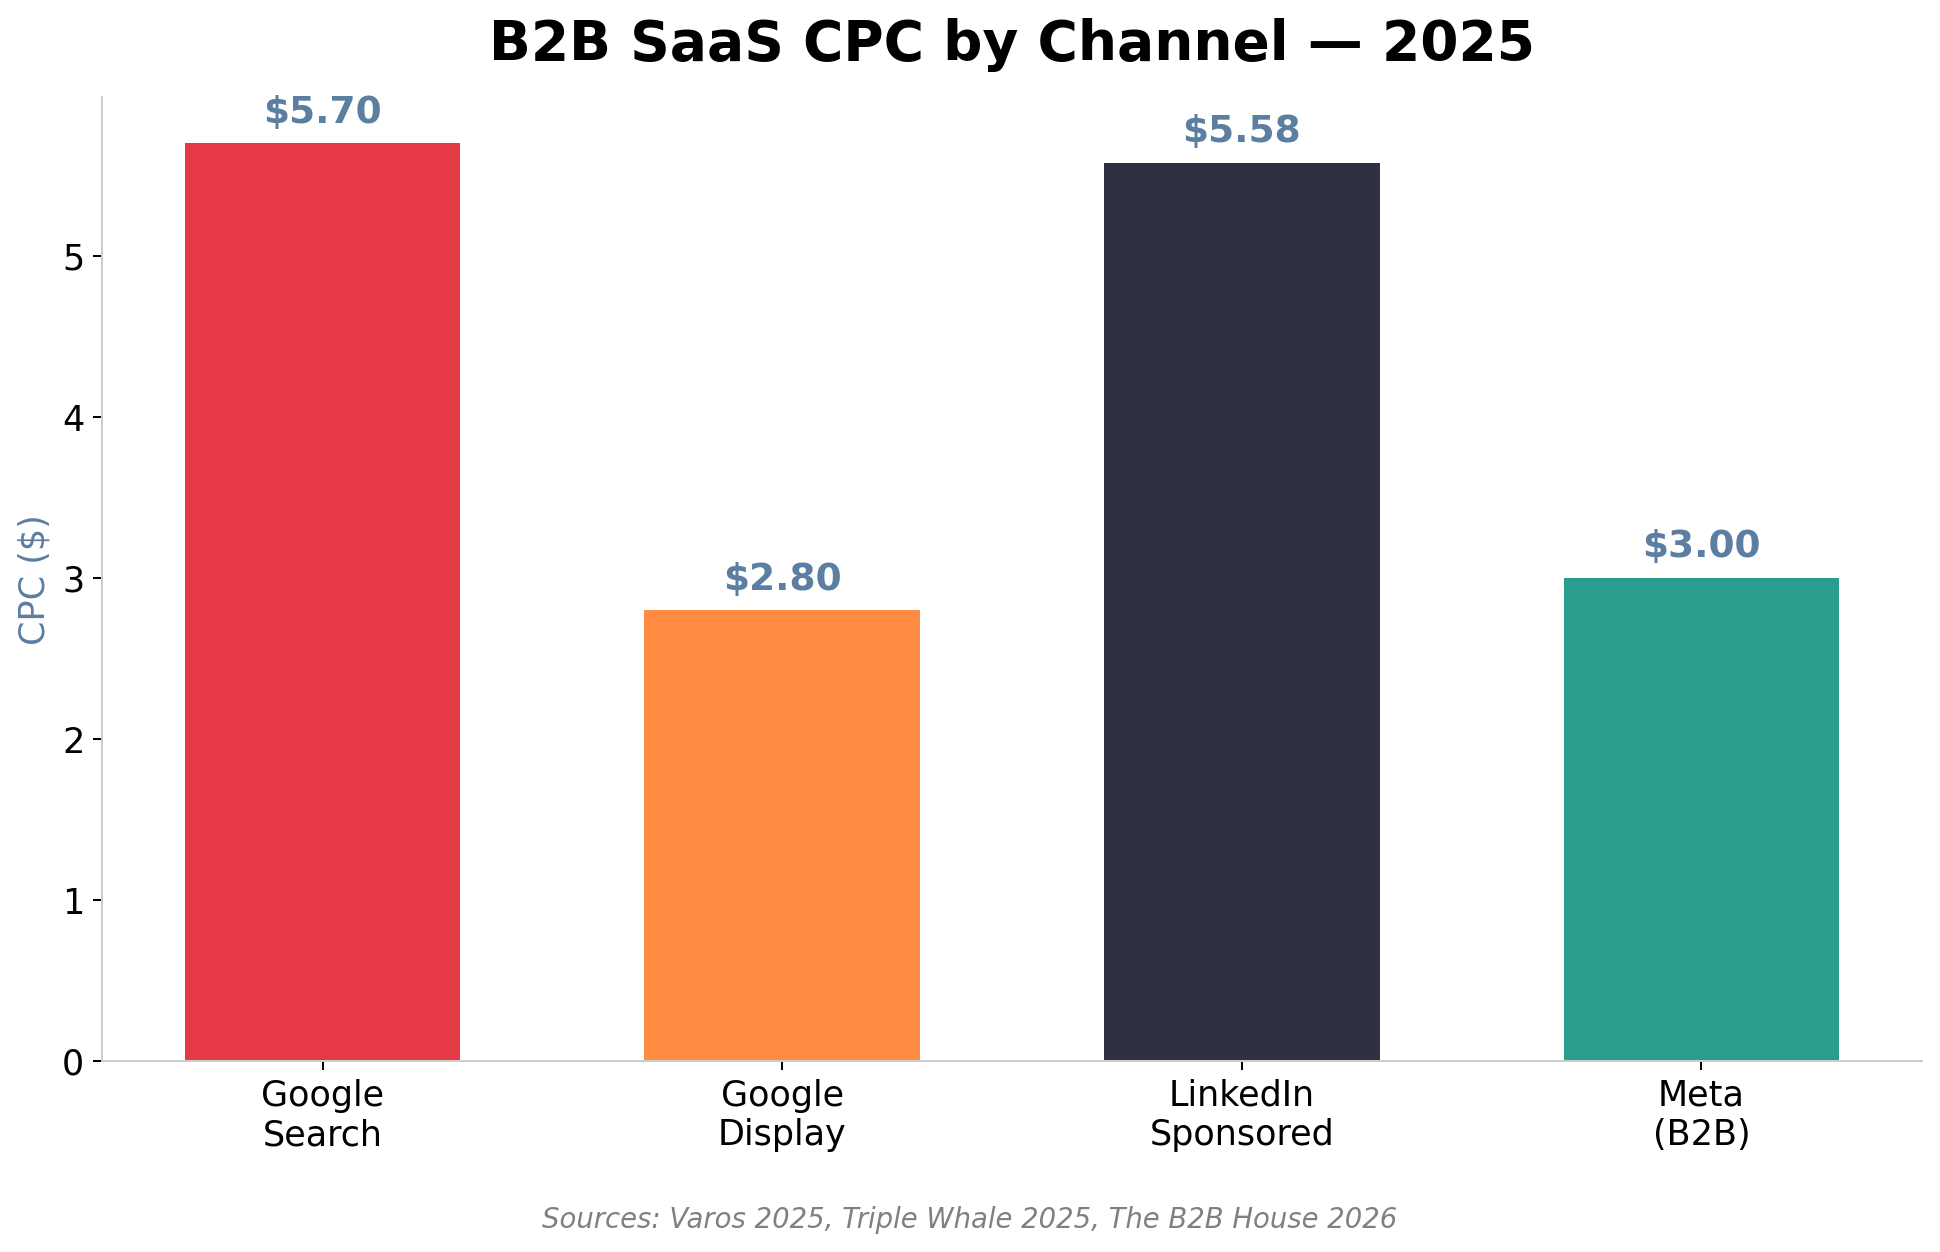
- Digital Advertising Benchmarks (Paid Social & Paid Search)
- LTV:CAC Ratios, S&M Payback & Ad Cost Payback
- M&A & VC Valuation Multiples
- 2026 Outlook & Key Takeaways
- Sources & Methodology
Key Report Findings:
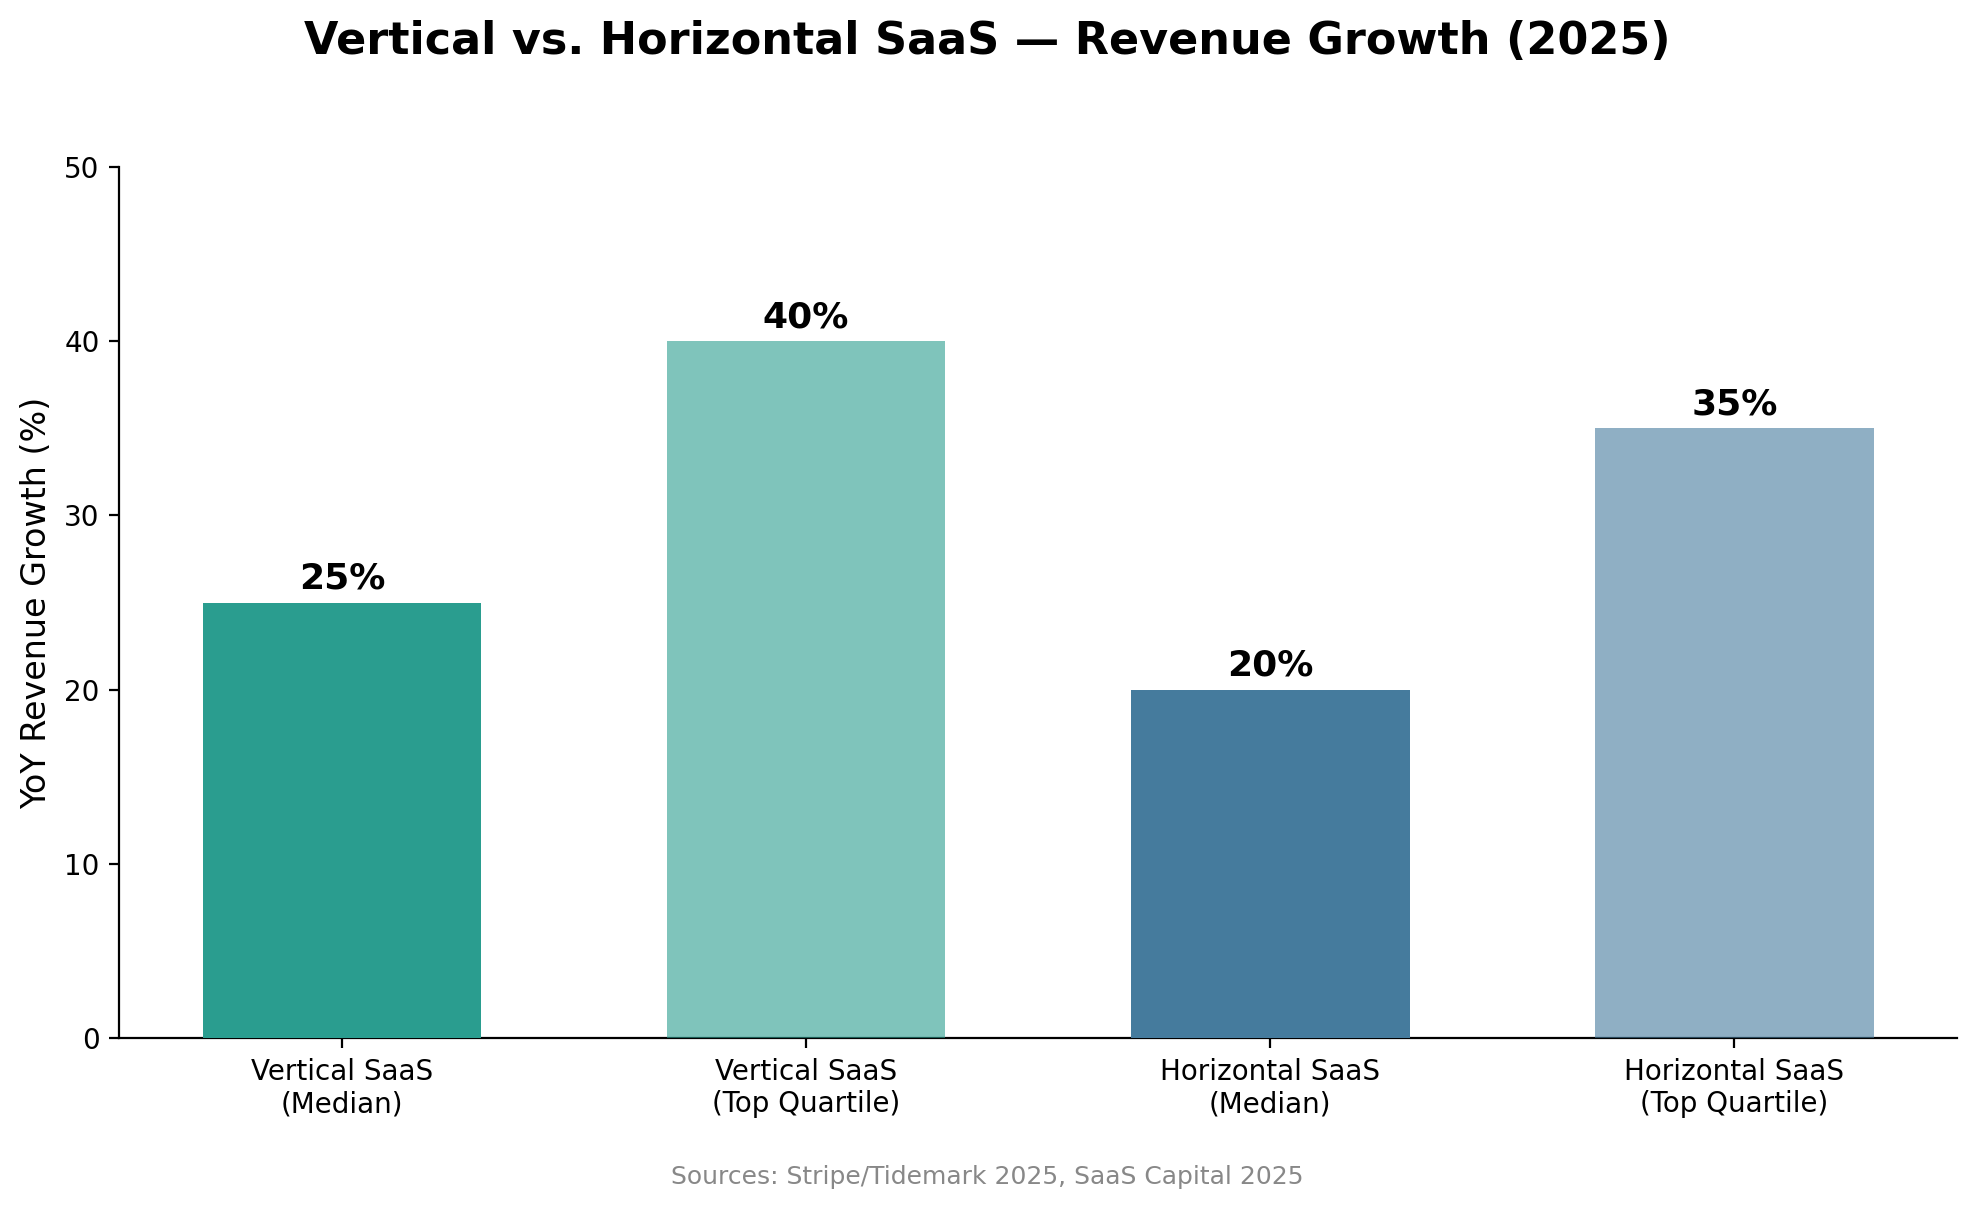
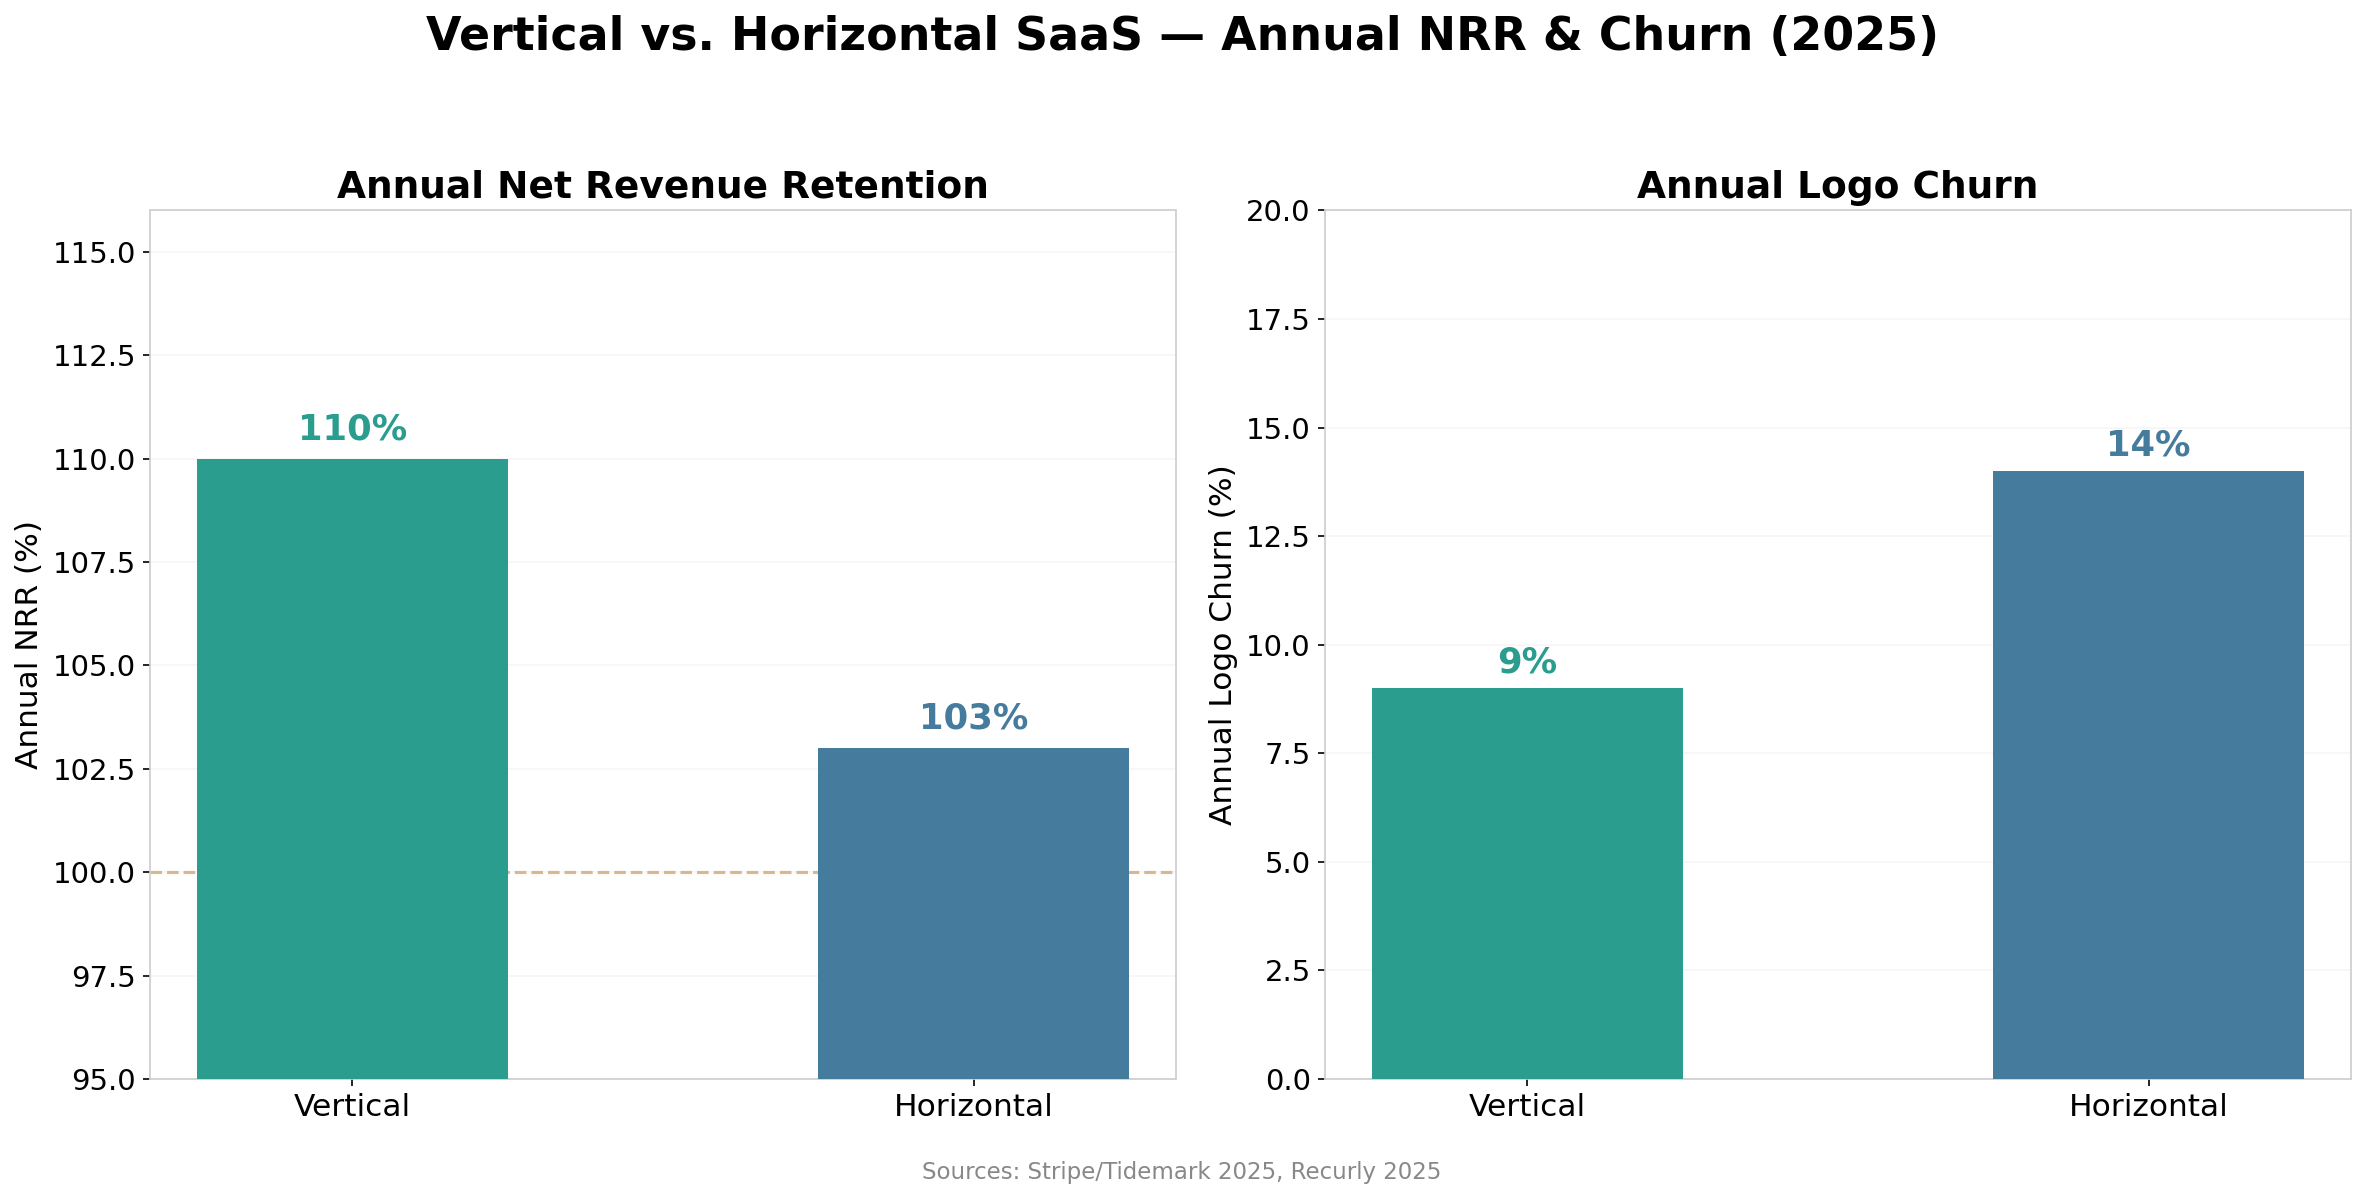
The data reveals a SaaS industry in transition — but one with enormous opportunity for companies that lean into AI. Median revenue growth settled at 26%, while Annual NRR compressed to 101% across all private B2B SaaS. Enterprise companies with ACVs above $100K retain at 118% Annual NRR and grow profitably at a median Rule of 40 of 42. AI-native companies grow at roughly 4x the aggregate rate of legacy peers (and 2x within the same ARR band per High Alpha), and the fastest AI-native companies are reaching $100M ARR in just 5.7 years vs. 7.5 years for the broader market (Bessemer). Vertical SaaS commands a 46% valuation premium over horizontal peers, driven by 92% Annual GRR, 112% Annual NRR, and embedded fintech revenue streams. Meanwhile, AI-embedded companies are achieving 12–18% operating margin improvements through automated support, AI-assisted code generation, and intelligent lead scoring — pointing to a future where the best SaaS companies combine strong growth with strong profitability.
Key 2026 SaaS Benchmarks at a Glance:
- Median SaaS Revenue Growth: 22% YoY (All Private B2B); SMB 28%, Mid-Market 22%, Enterprise 17%
- Net Revenue Retention (NRR): 102% median (All B2B); SMB 100%, Mid-Market 104%, Enterprise 115%
- Annual Account Churn: SMB 15%, Mid-Market 10%, Enterprise 5%
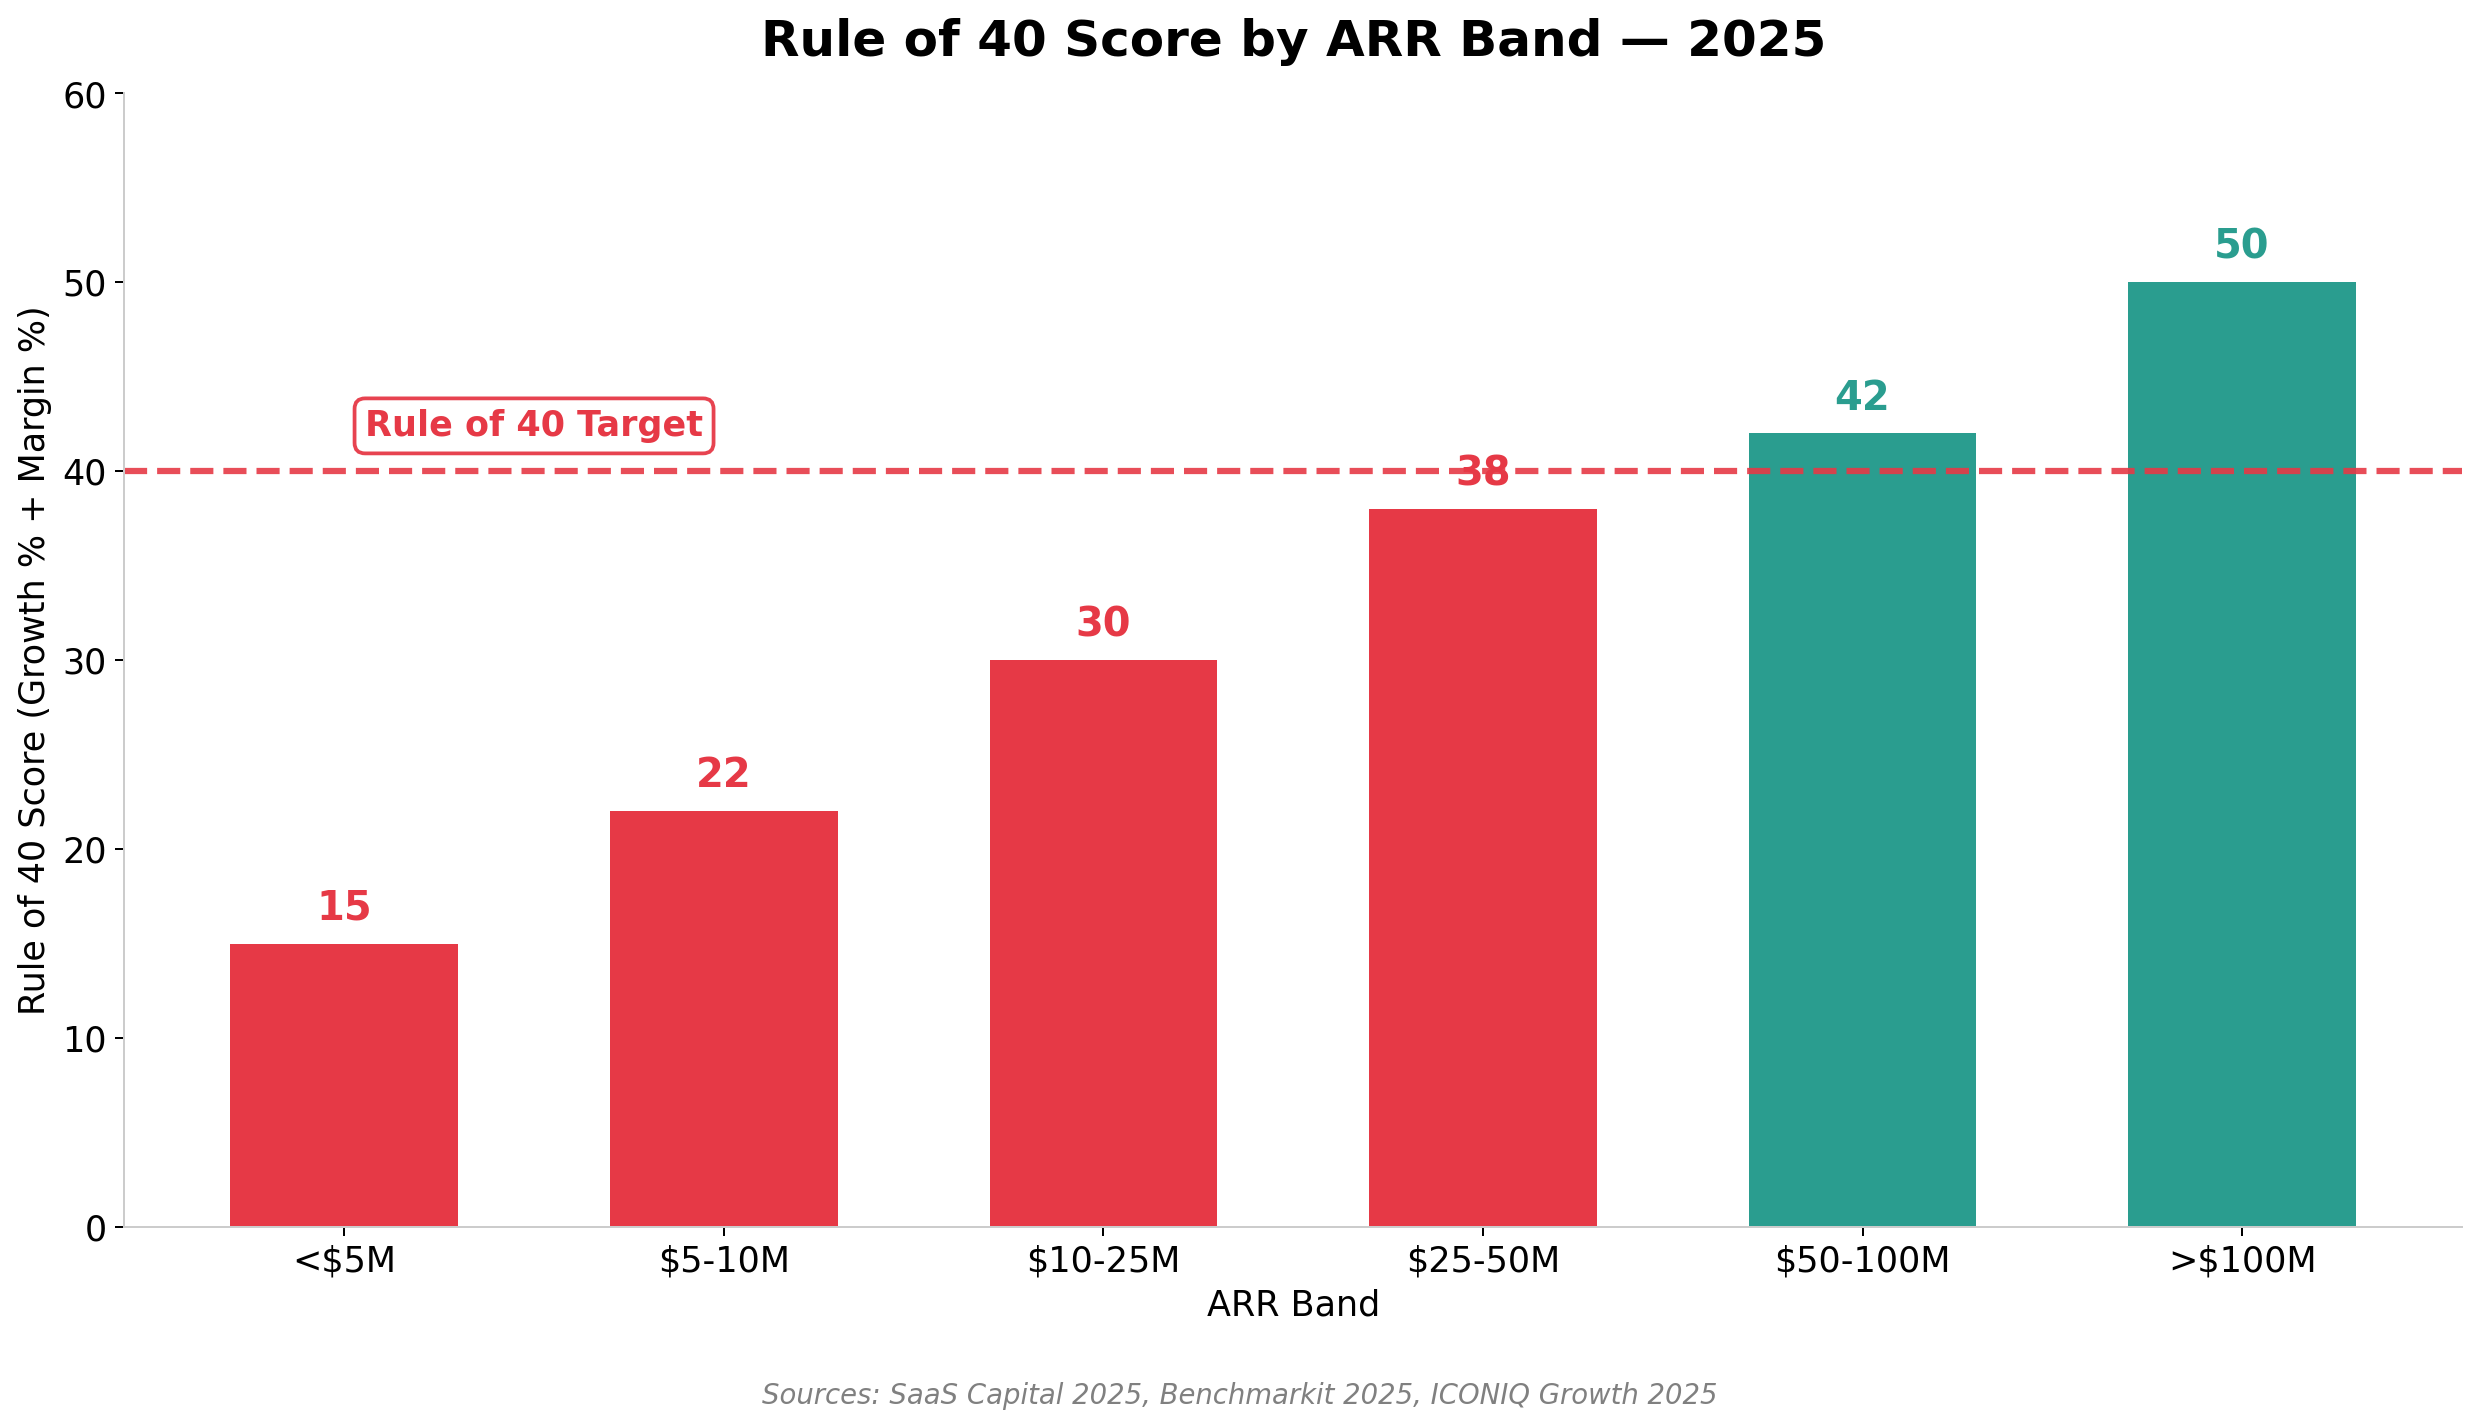
- Rule of 40: Median scores range from 15 (under $5M ARR) to 50 (above $100M ARR)
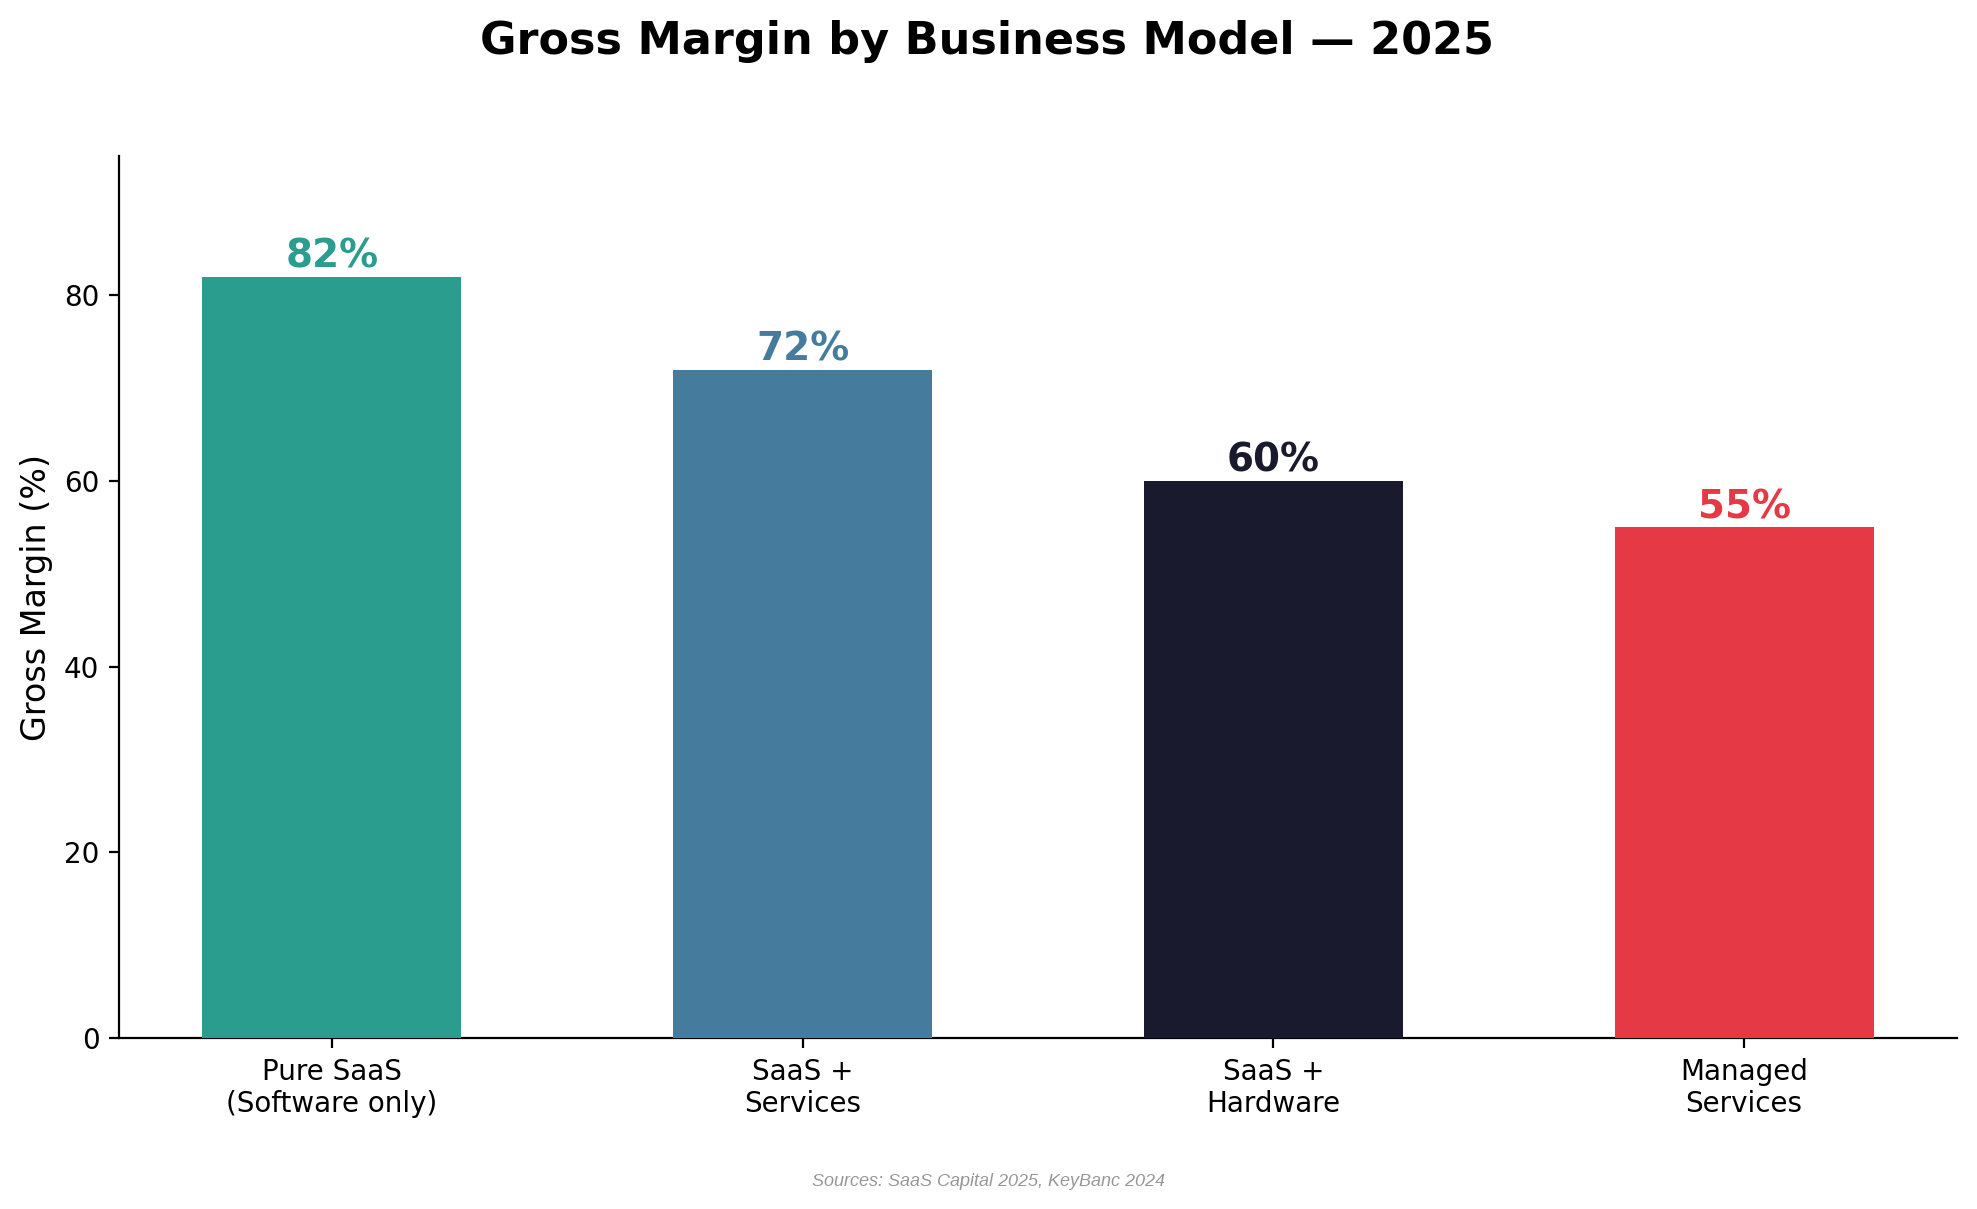
- SaaS Gross Margin: 75% median (All B2B); Pure SaaS 82%, SaaS+Services 72%
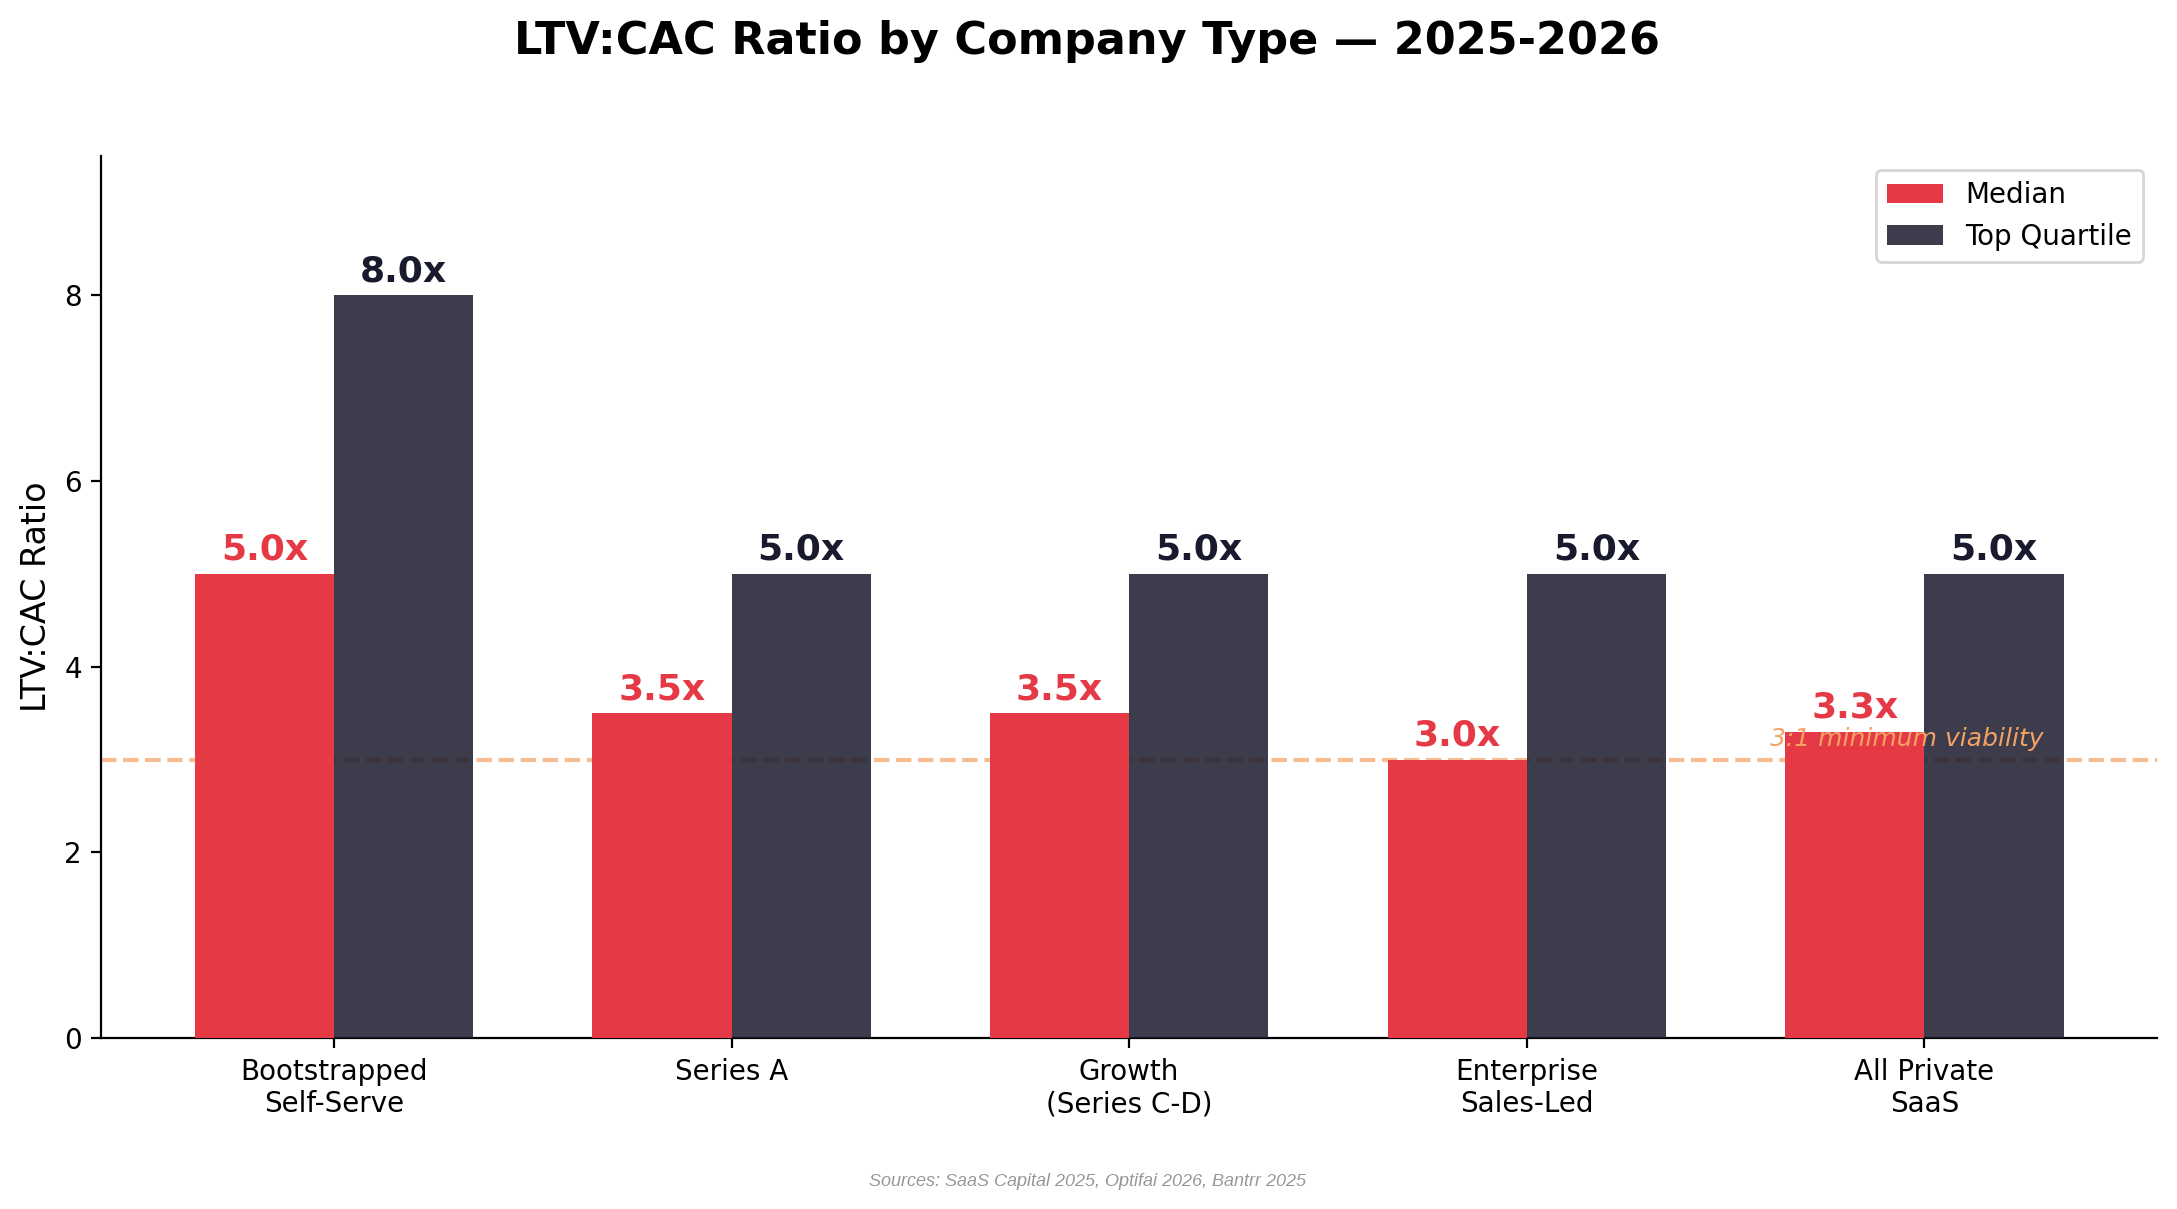
- LTV:CAC Ratio: 3.3x median (All Private); Bootstrapped 5.0x, Enterprise Sales-Led 3.0x
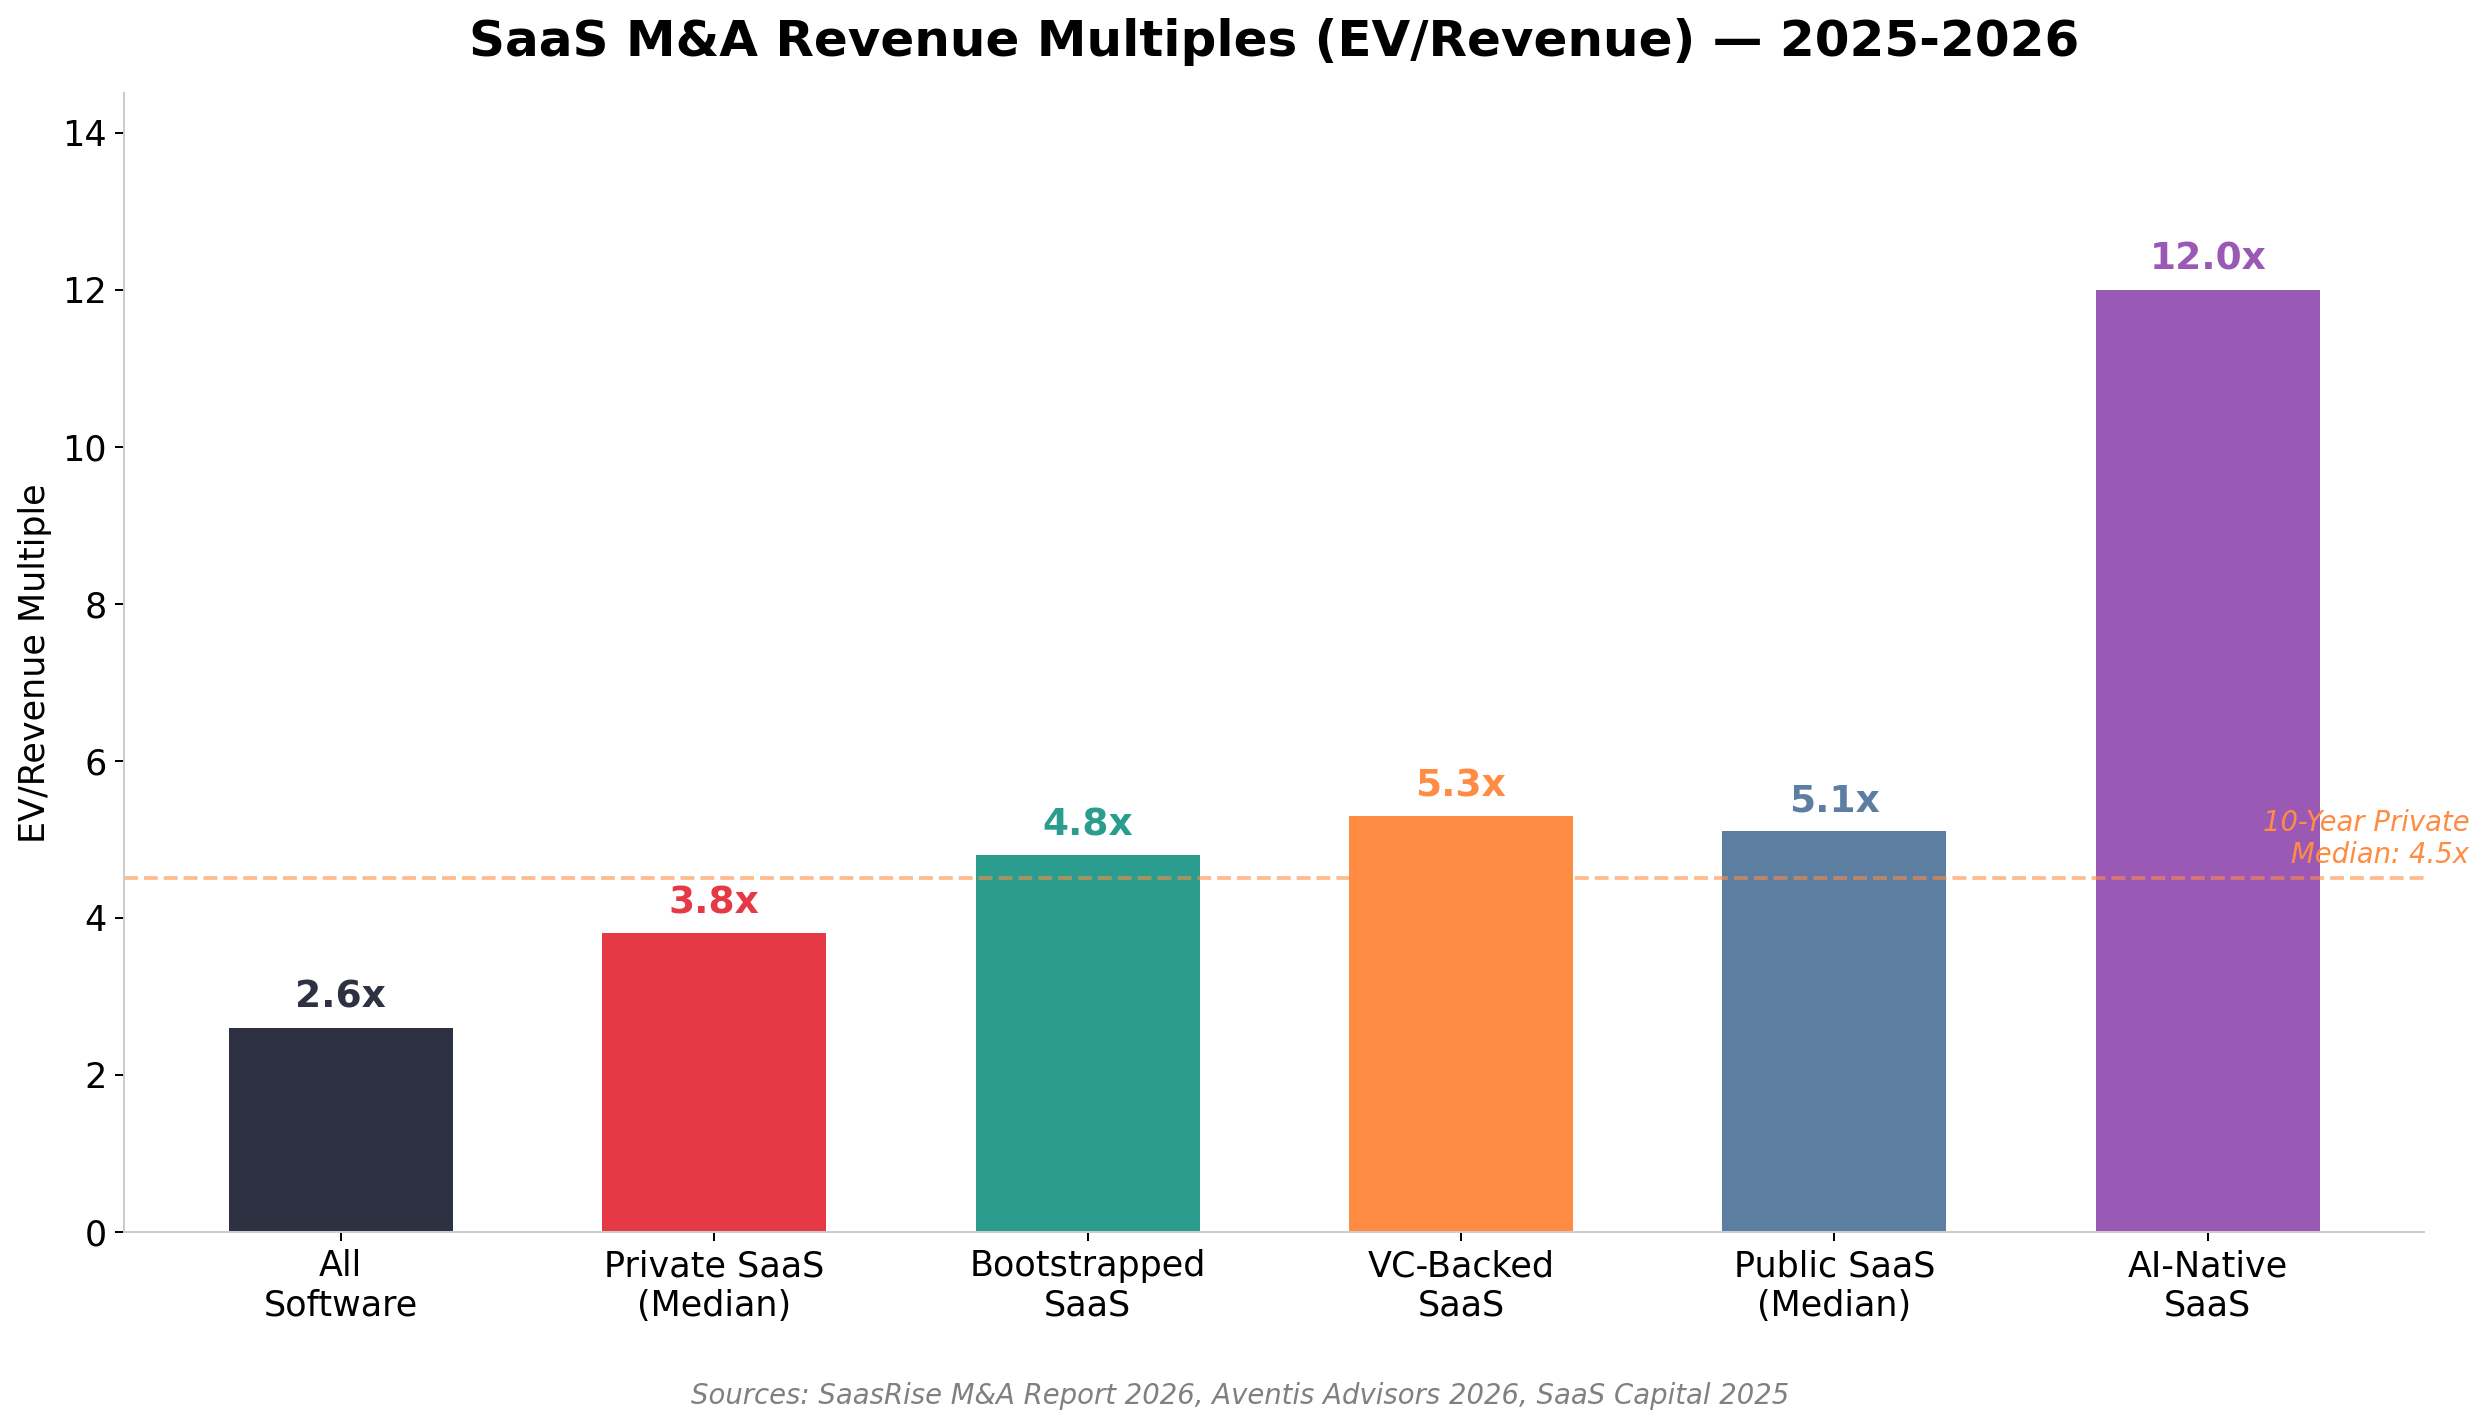
- M&A Revenue Multiples: Private SaaS 3.8x, Bootstrapped 4.8x, AI-Native 10–15x+
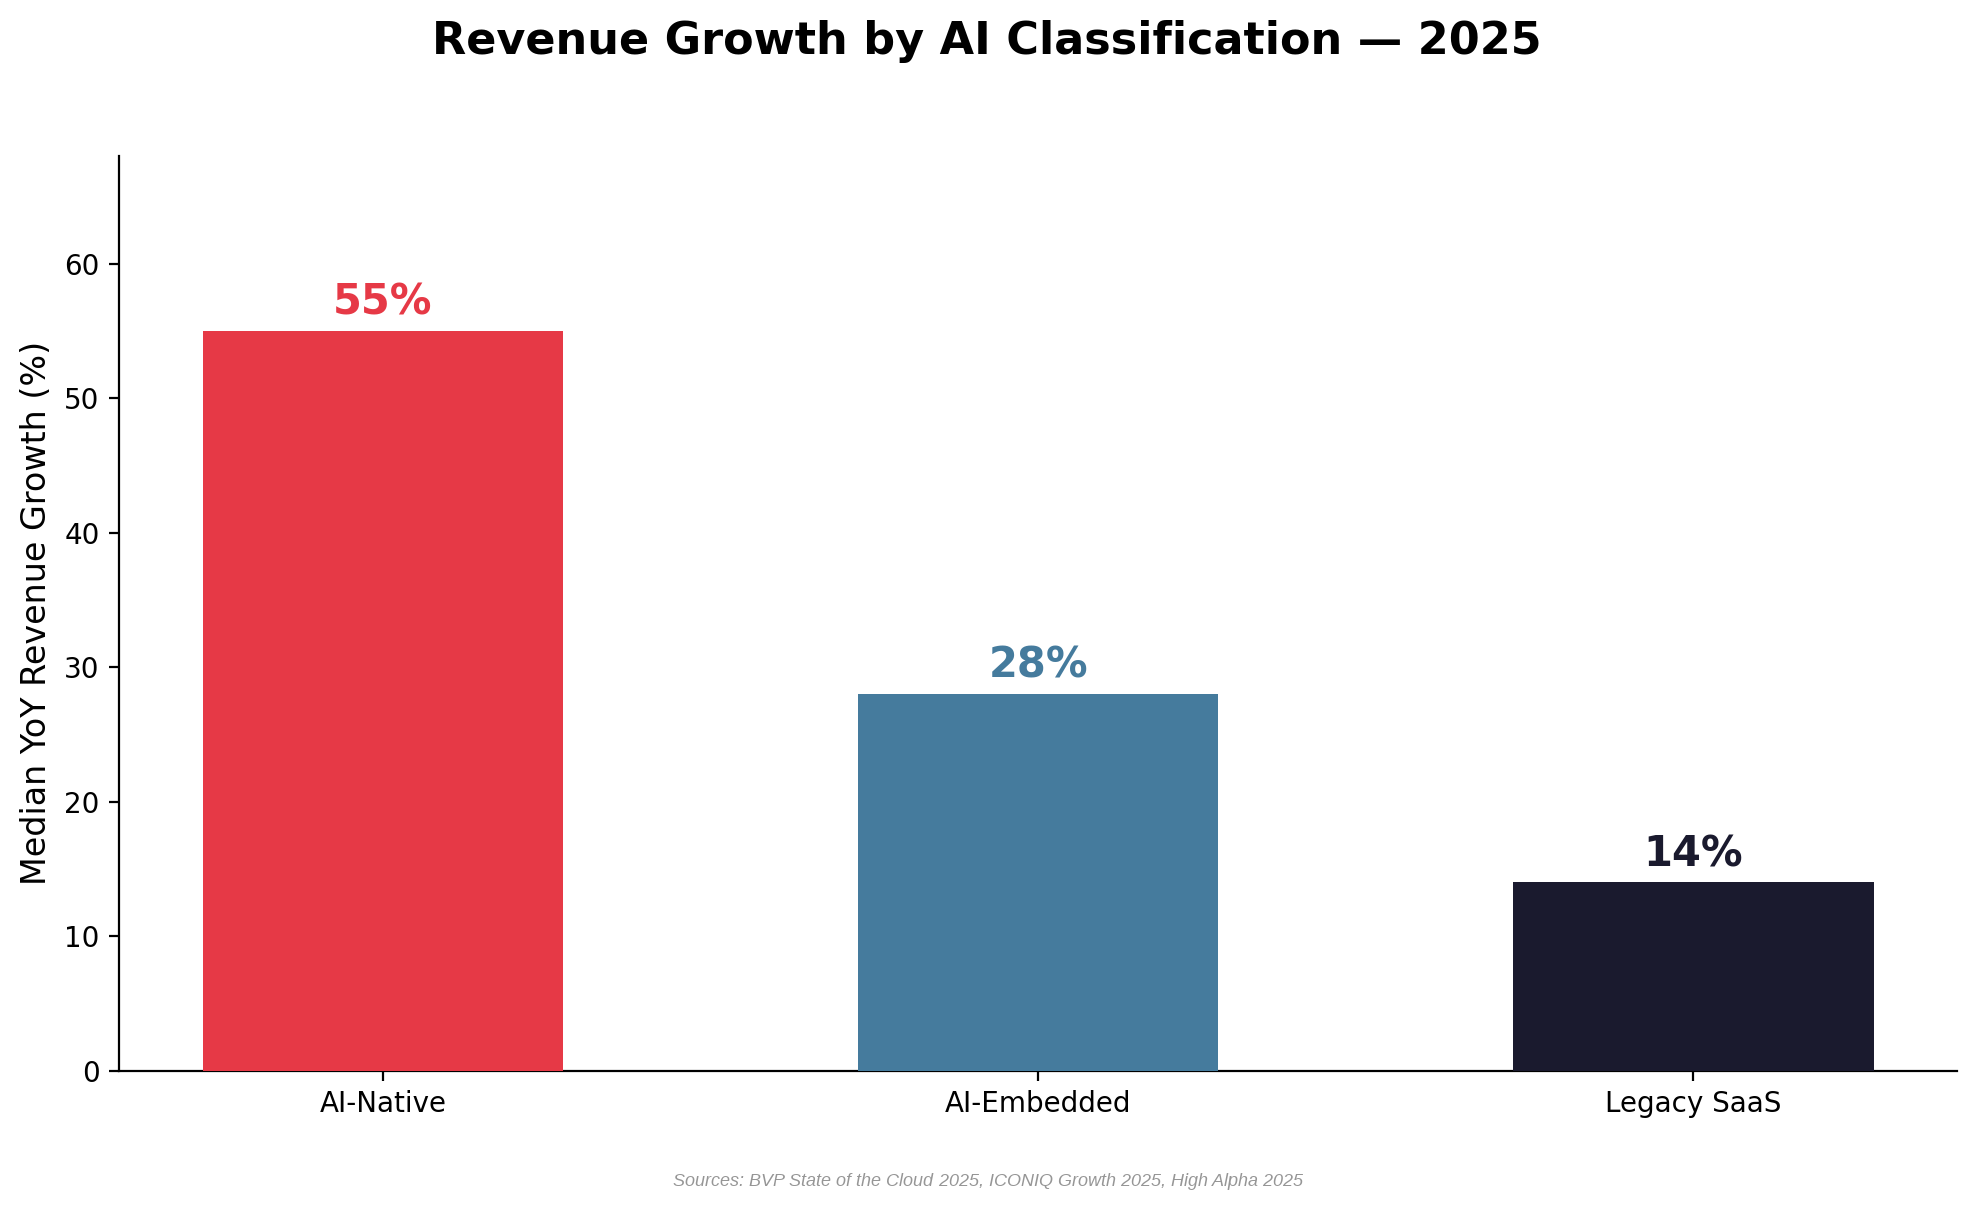
- AI-Native vs. Legacy Growth: AI-native 55% vs. Legacy 14% median revenue growth
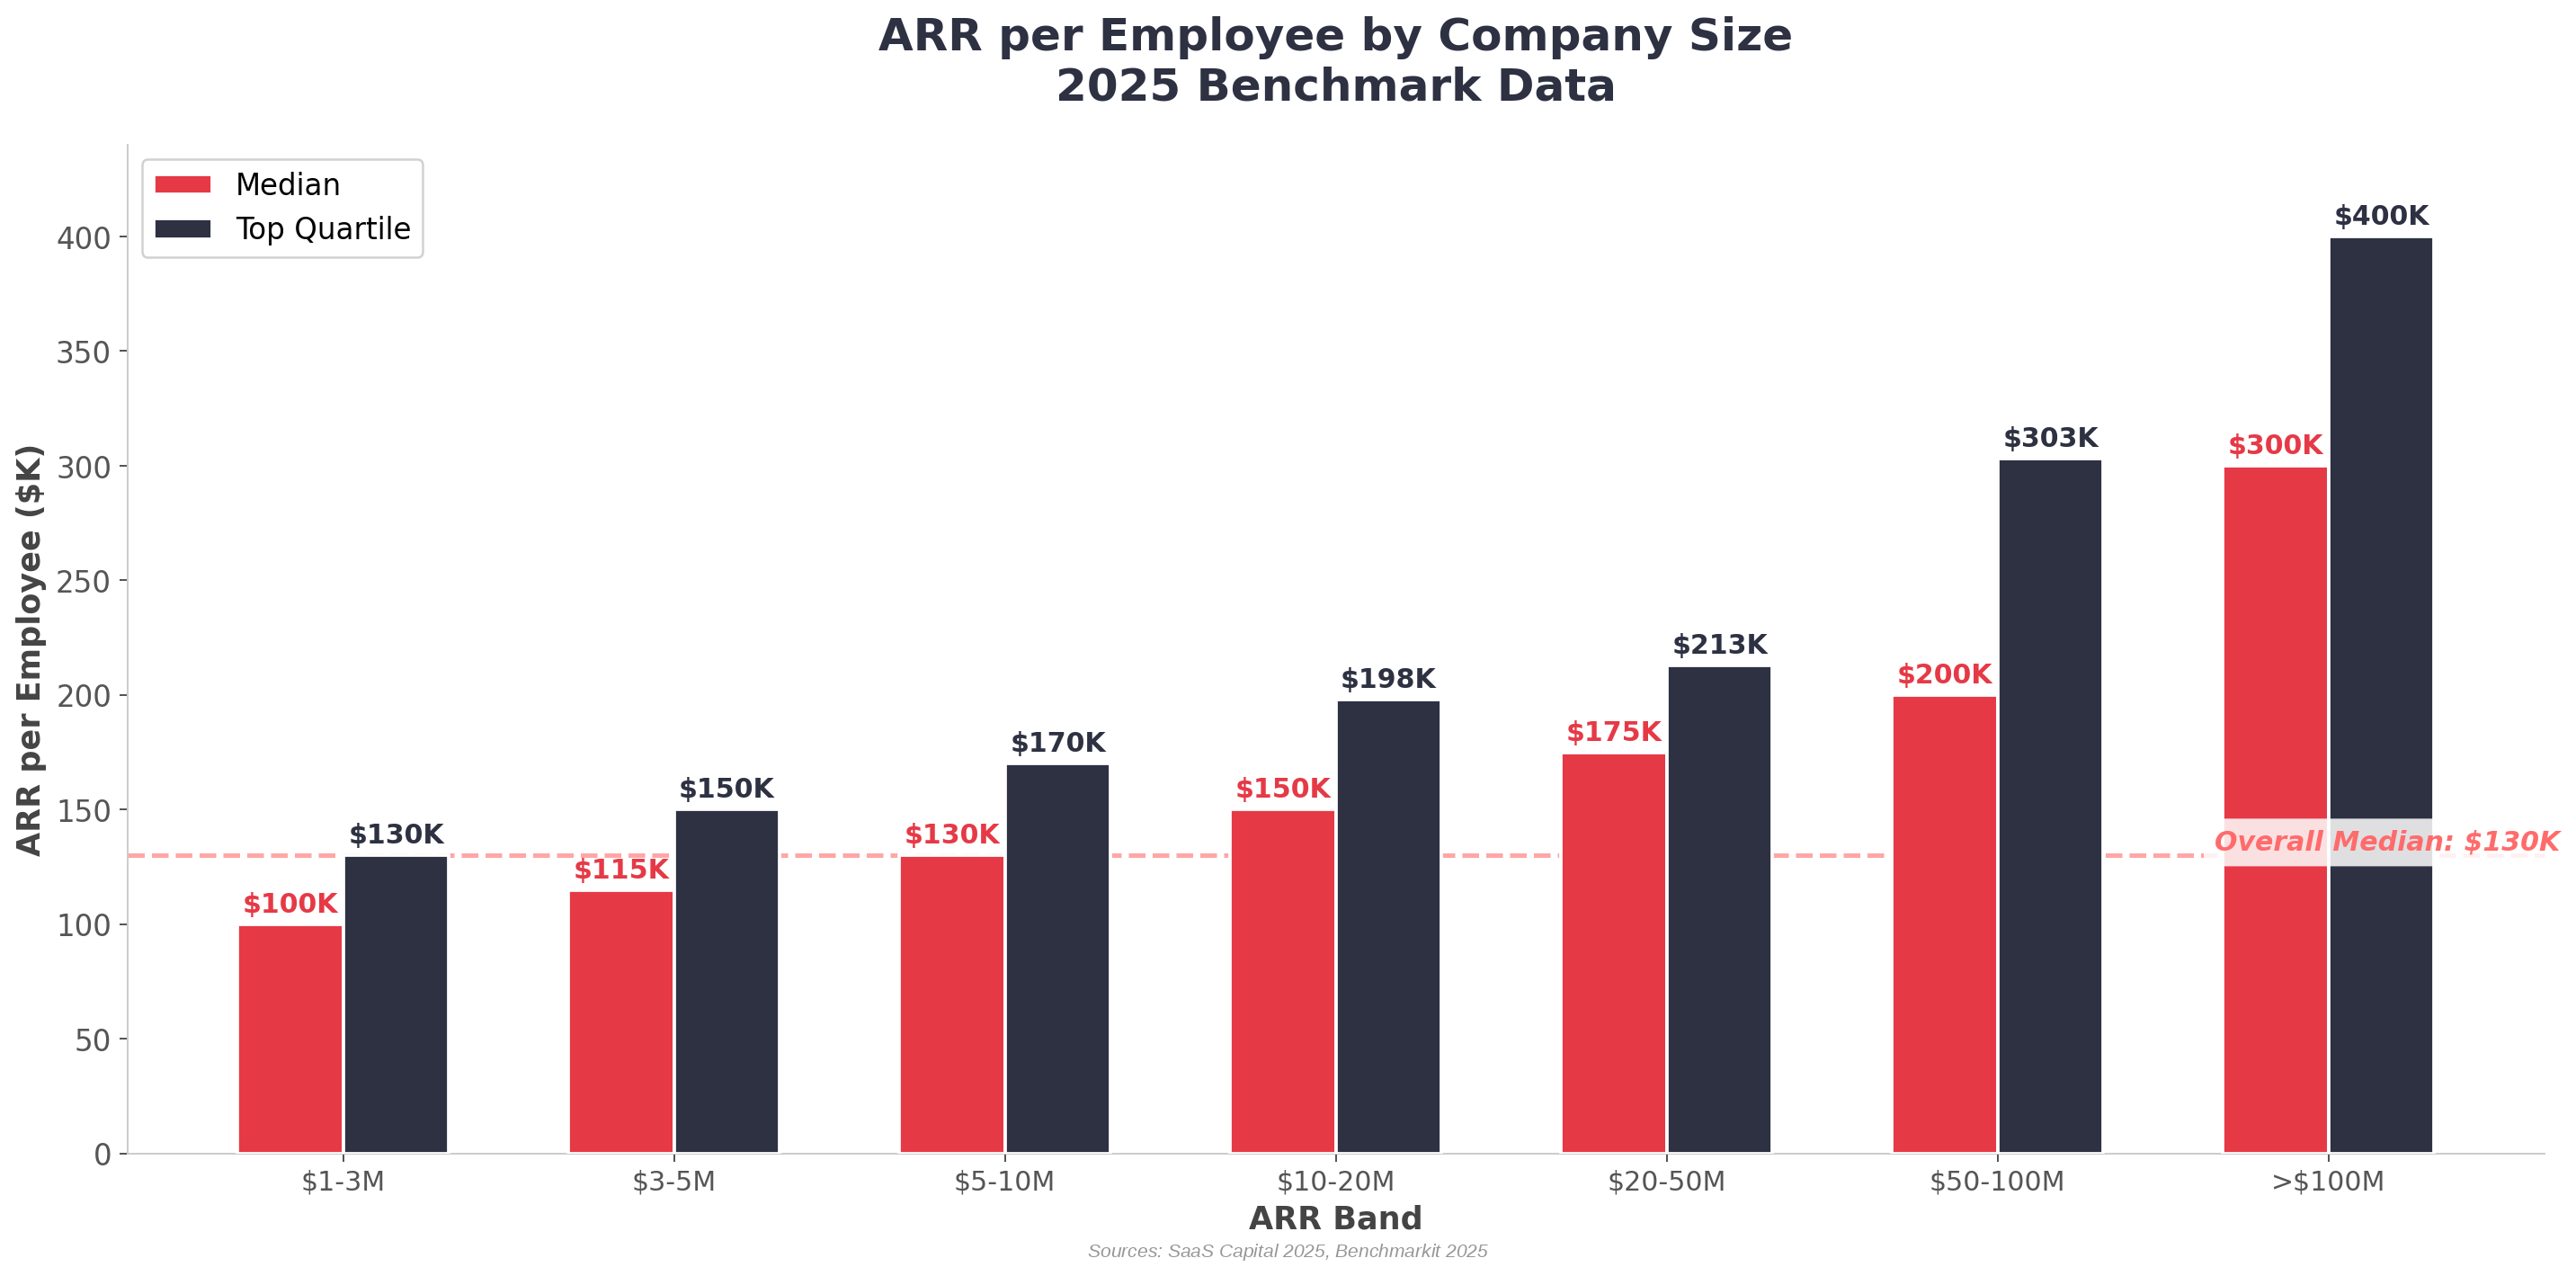
- Revenue per Employee: $130K (under $5M ARR) to $300K+ (above $100M ARR)
Median SaaS Benchmarks (All Private B2B SaaS)
Profitability & Efficiency
AI & Vertical Premiums
1. The SaaS Founder Target Benchmarks for 2026
Here’s a summary of the benchmarks below if you’re running a SaaS company and want to be in a strong position to raise, grow, or exit by 2027.
Your Target Scorecard
If you hit these numbers by late 2027, you’ll be in the top quartile of SaaS companies at your stage — well-positioned for a strong Series A/B raise or a 5x+ revenue multiple exit.
| Metric | Your Target | Why It Matters |
|---|---|---|
| Revenue Growth | 40–60% YoY | The median $5–10M company grows 35%. You need to be above median to command premium valuations. |
| Net Revenue Retention (NRR) | ≥110% | This means your existing customers grow 10%+ each year without any new sales. It’s the #1 predictor of long-term value. |
| Gross Revenue Retention (GRR) | ≥90% | You’re keeping 90%+ of existing revenue. Below 85%, your bucket leaks faster than you can fill it. |
| Monthly Logo Churn | <2% | That’s <24% annual churn. The median for mid-market is 2.3%/month — beat it. |
| Rule of 40 Score | ≥30 (aim for 40+) | Growth Rate % + Profit Margin % = 30+. At your stage, lean toward growth (e.g. 40% growth + −10% margin = 30). |
| Gross Margin | ≥75% | This is the SaaS benchmark. If your margin is below 70%, your hosting/support costs may be too high. |
| LTV:CAC Ratio | >4:1 | You earn $4+ for every $1 spent acquiring a customer. Below 3x, you’re spending too much on acquisition. |
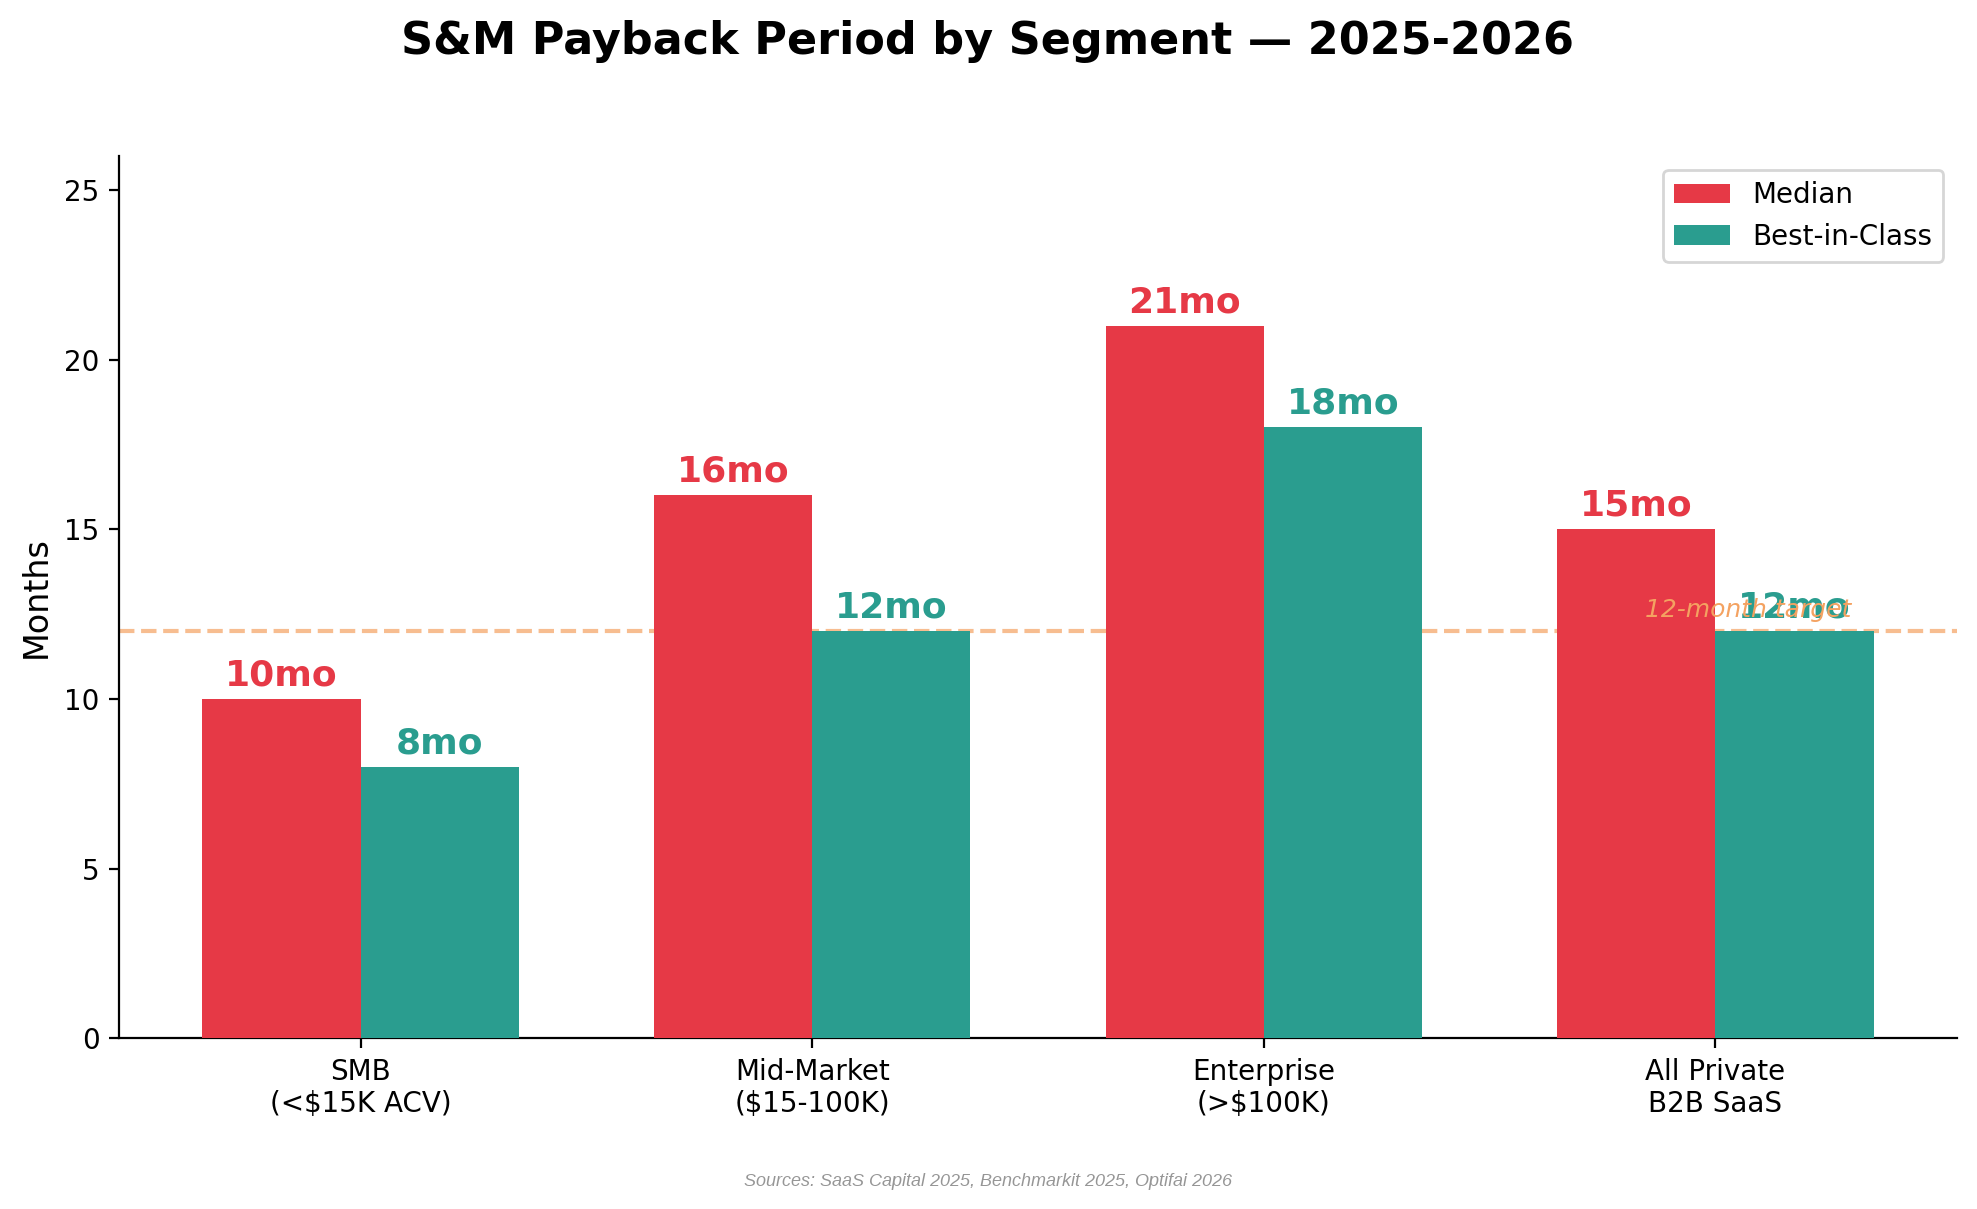
| CAC Payback | <12 months | How long to recover the cost of winning a customer. Under 12 months is the target; over 18 months is a red flag. |
| Revenue per Employee | $150–200K+ | The median at your stage is $139K. Higher = more efficient team. Use AI tools to boost this. |
2. Revenue Growth Benchmarks
Revenue growth remains the most visible SaaS metric, but the range across segments has widened dramatically. Smaller, earlier-stage companies still grow faster in absolute terms, but the gap between top quartile and bottom quartile has compressed as the market matures.
Revenue growth varies significantly by market segment, with SMB companies growing fastest in percentage terms but enterprise companies delivering more predictable, capital-efficient growth.
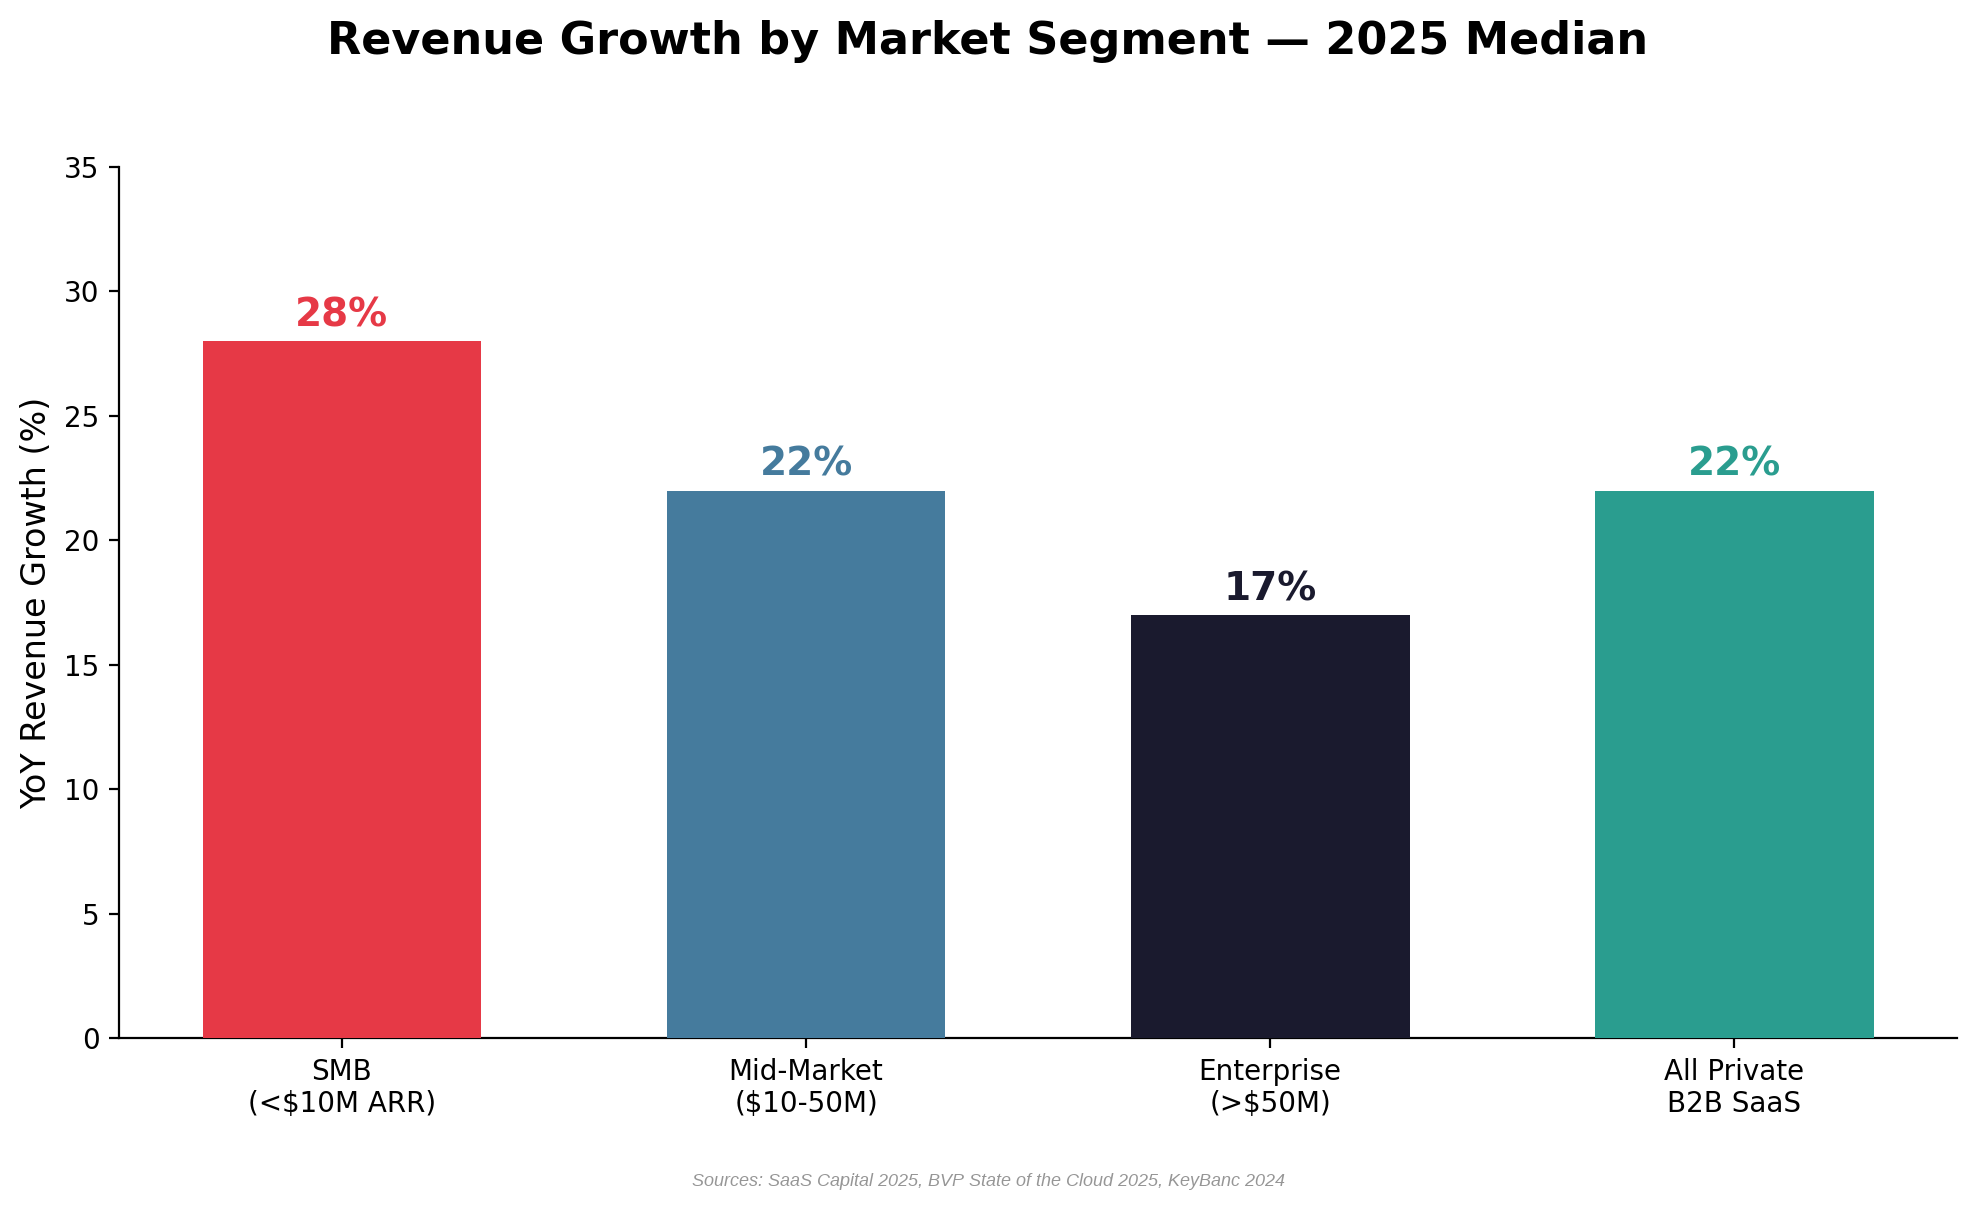
Figure 1a: Revenue growth by market segment — SMB leads at 28% median but with higher variance. Sources: SaaS Capital 2025, BVP State of the Cloud 2025, KeyBanc 2024
When broken down by ARR band, the relationship between size and growth becomes even more pronounced. Companies below $1M ARR grow at a median of 85%, while those above $100M grow at just 14% — but with far greater efficiency.
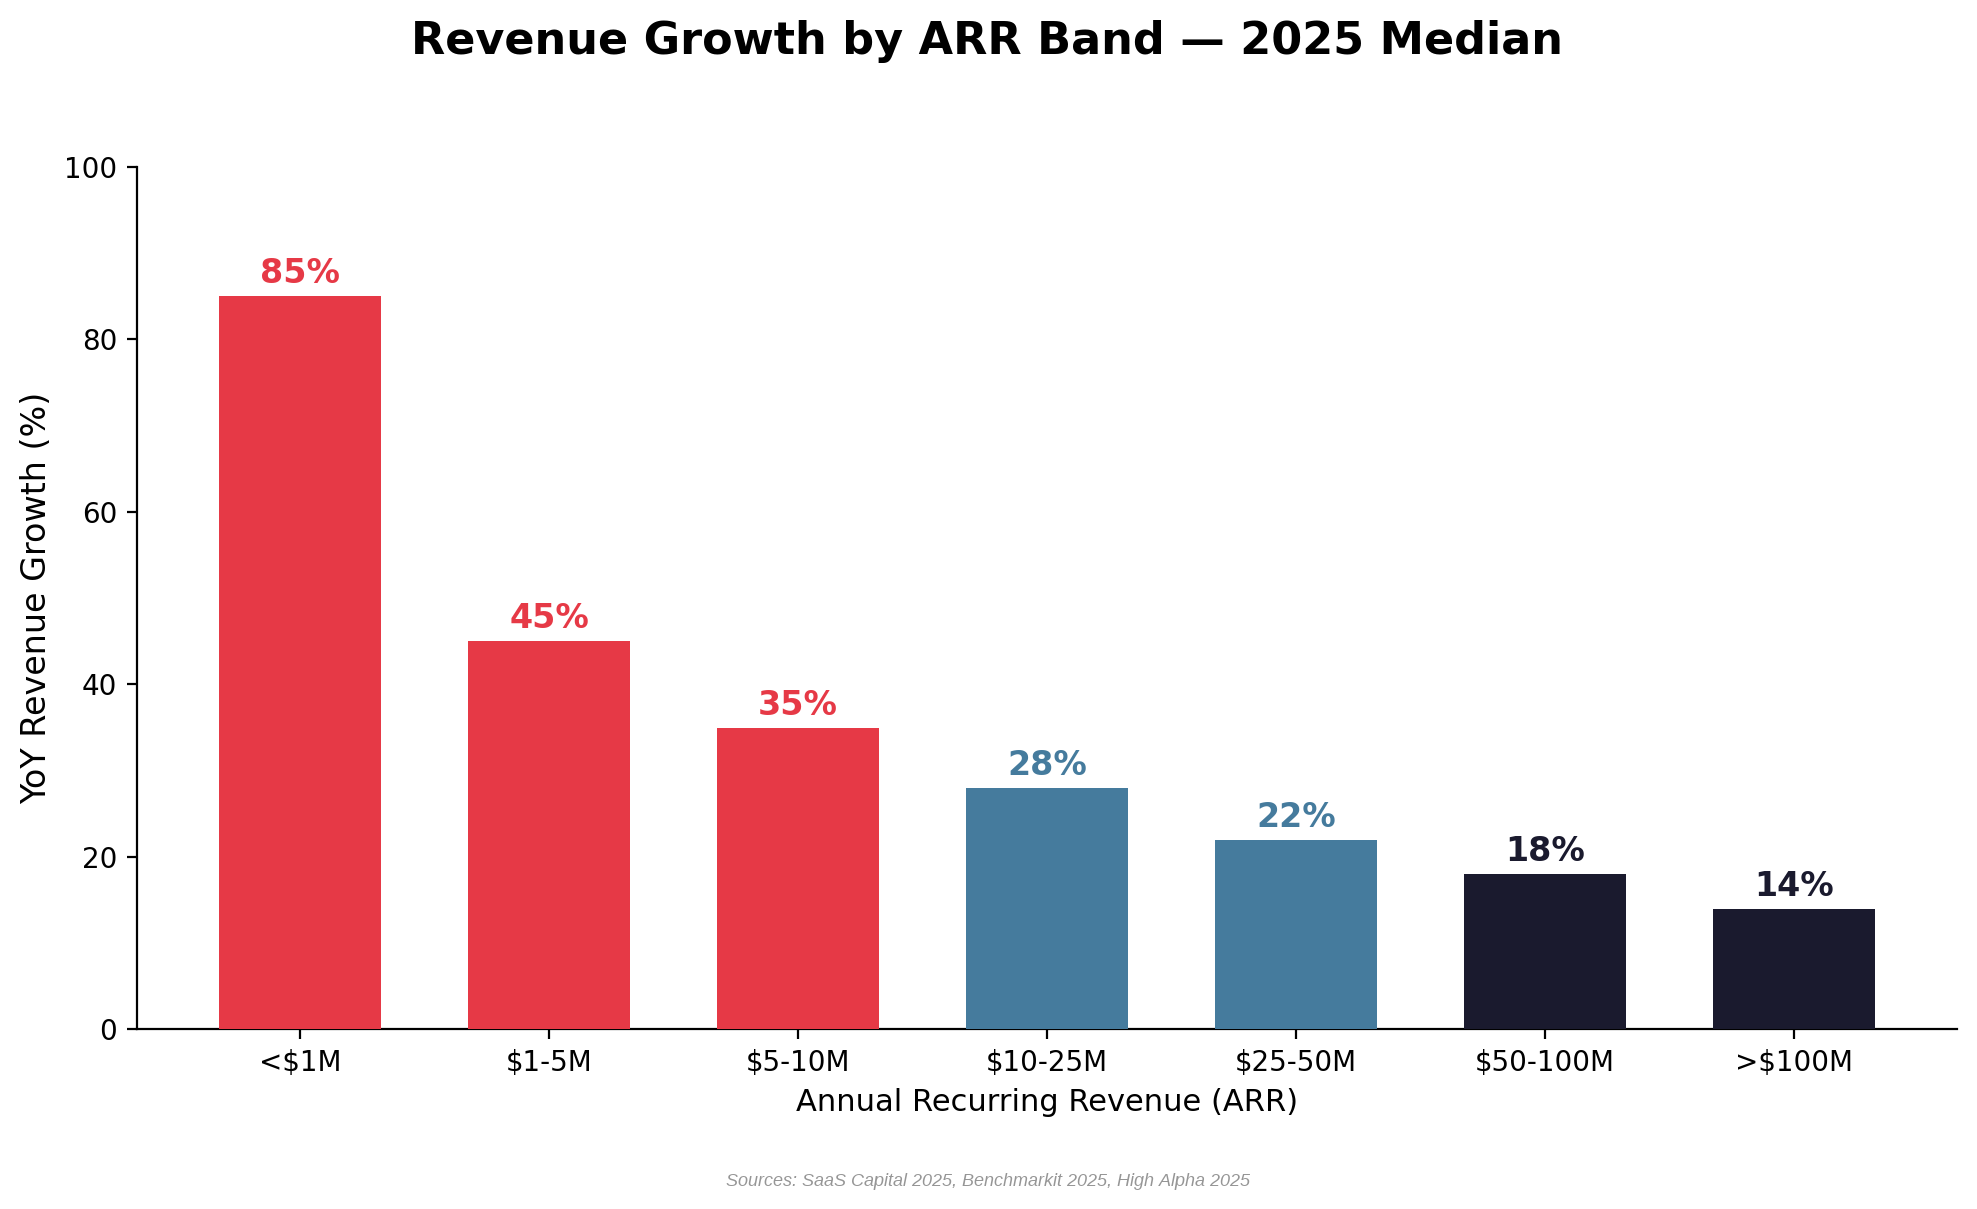
Figure 1b: Revenue growth by ARR band — growth rate declines predictably as scale increases. Sources: SaaS Capital 2025, Benchmarkit 2025, High Alpha 2025
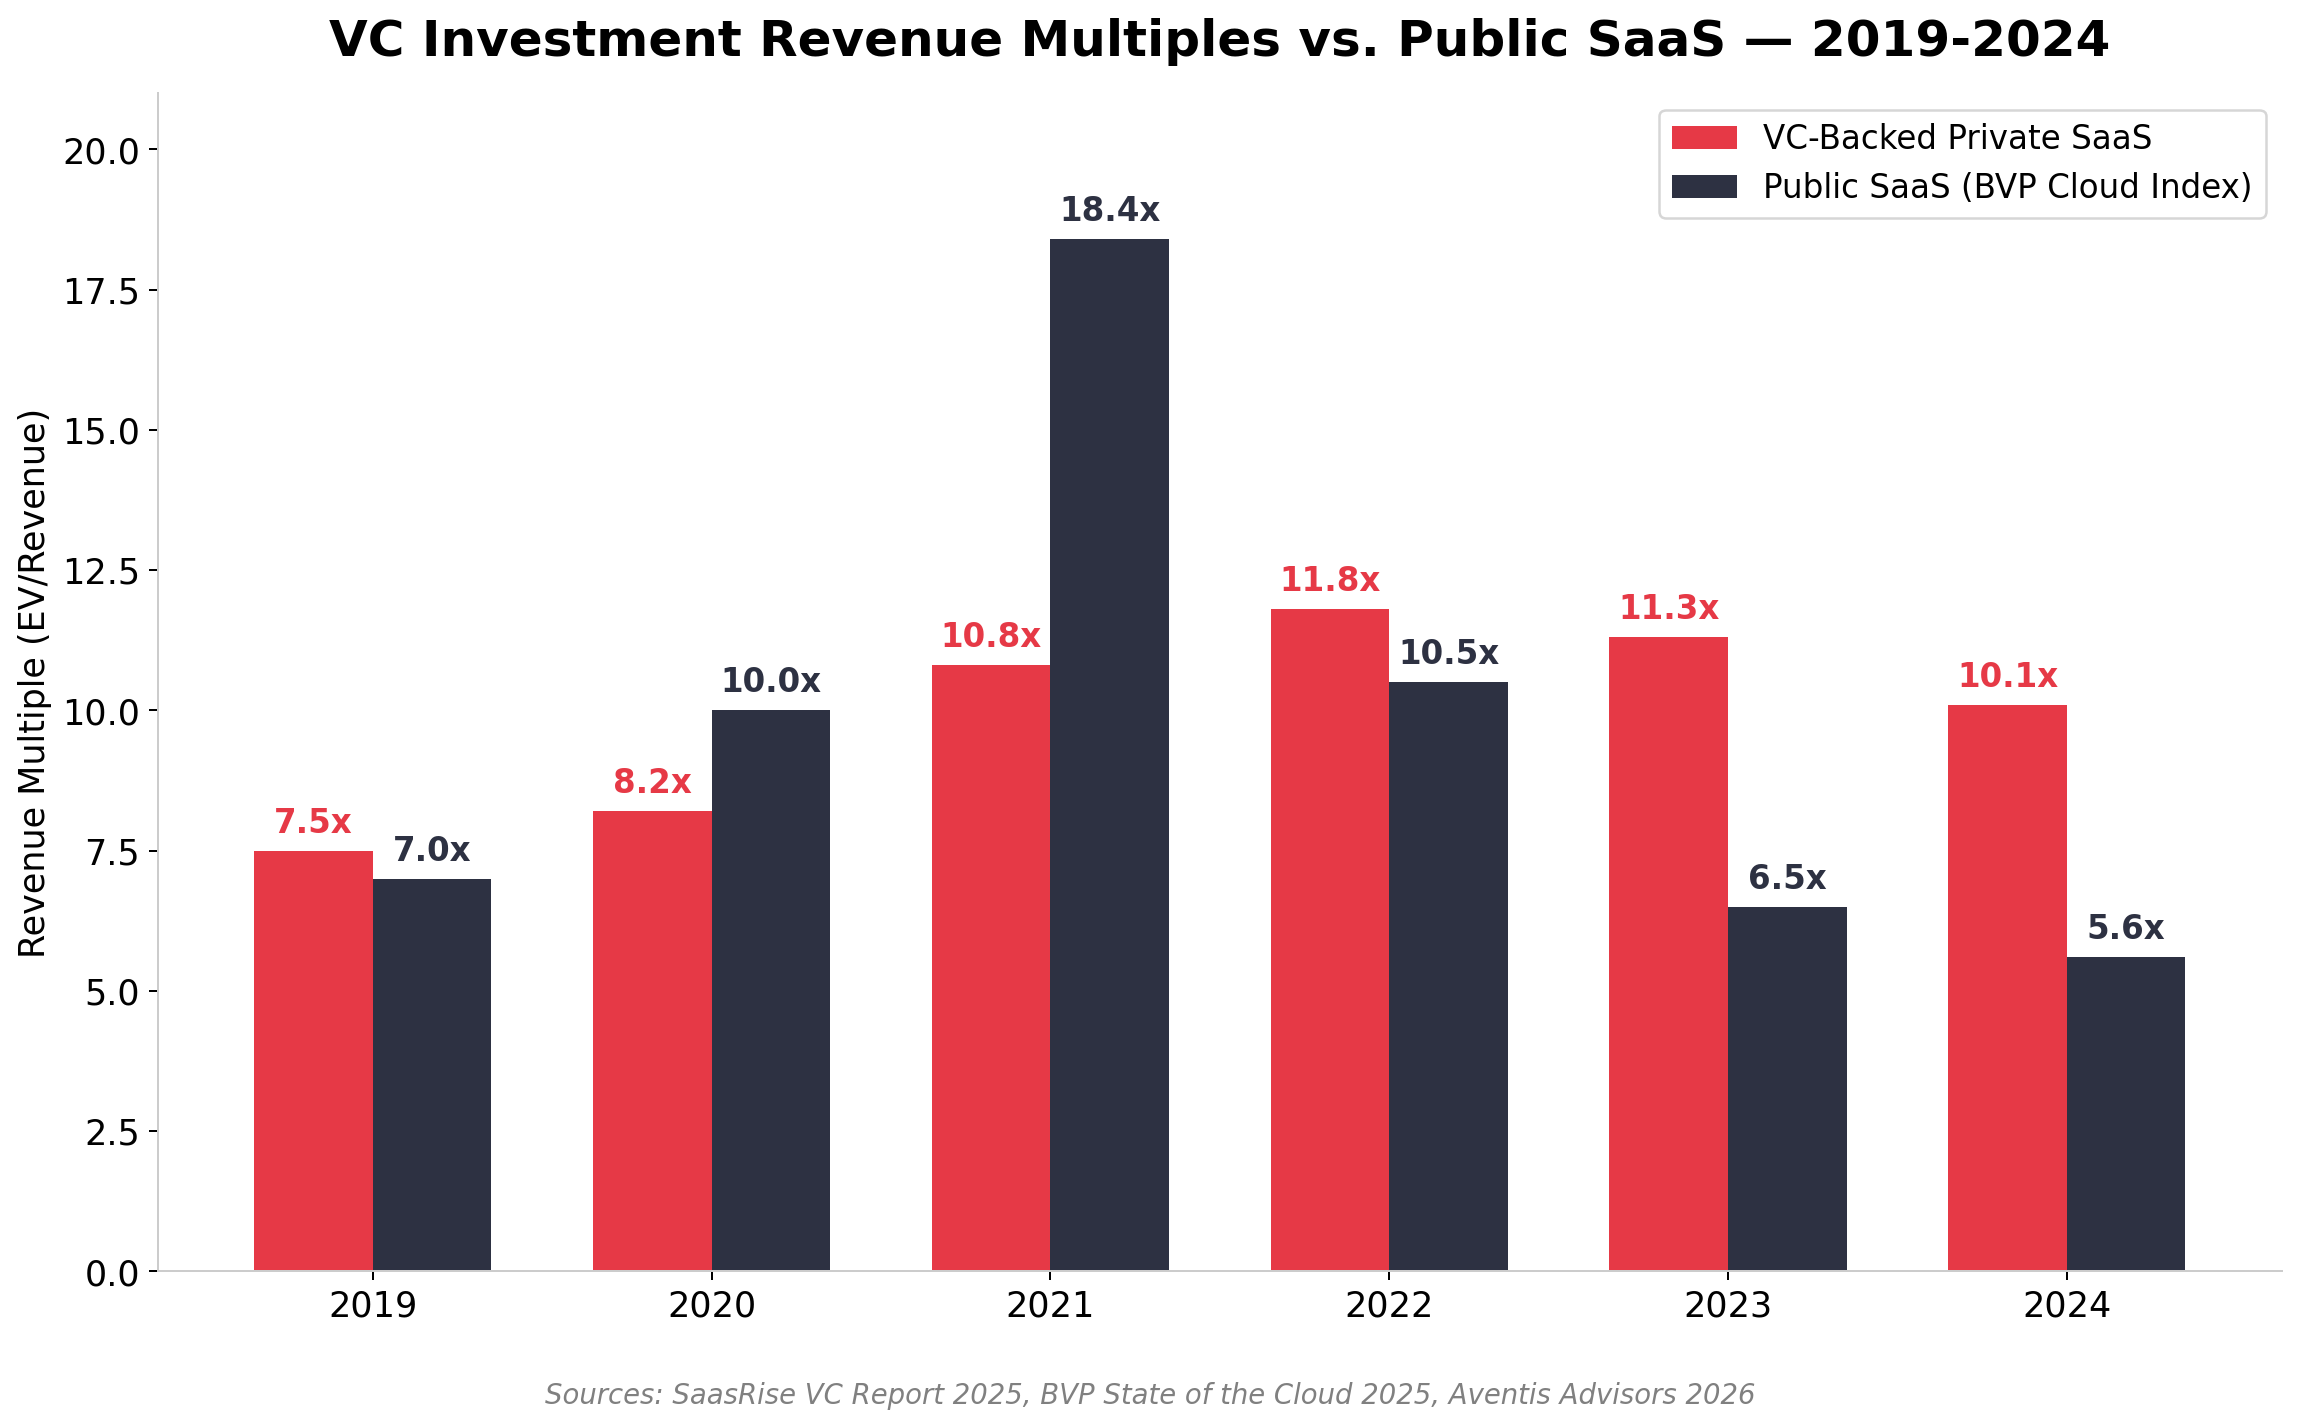
Growth rates also vary significantly by funding model. VC-backed companies grow roughly 2x faster than bootstrapped peers, but at much higher burn rates. PE-owned SaaS companies, focused on cash flow and debt service, grow slowest at 12% median.
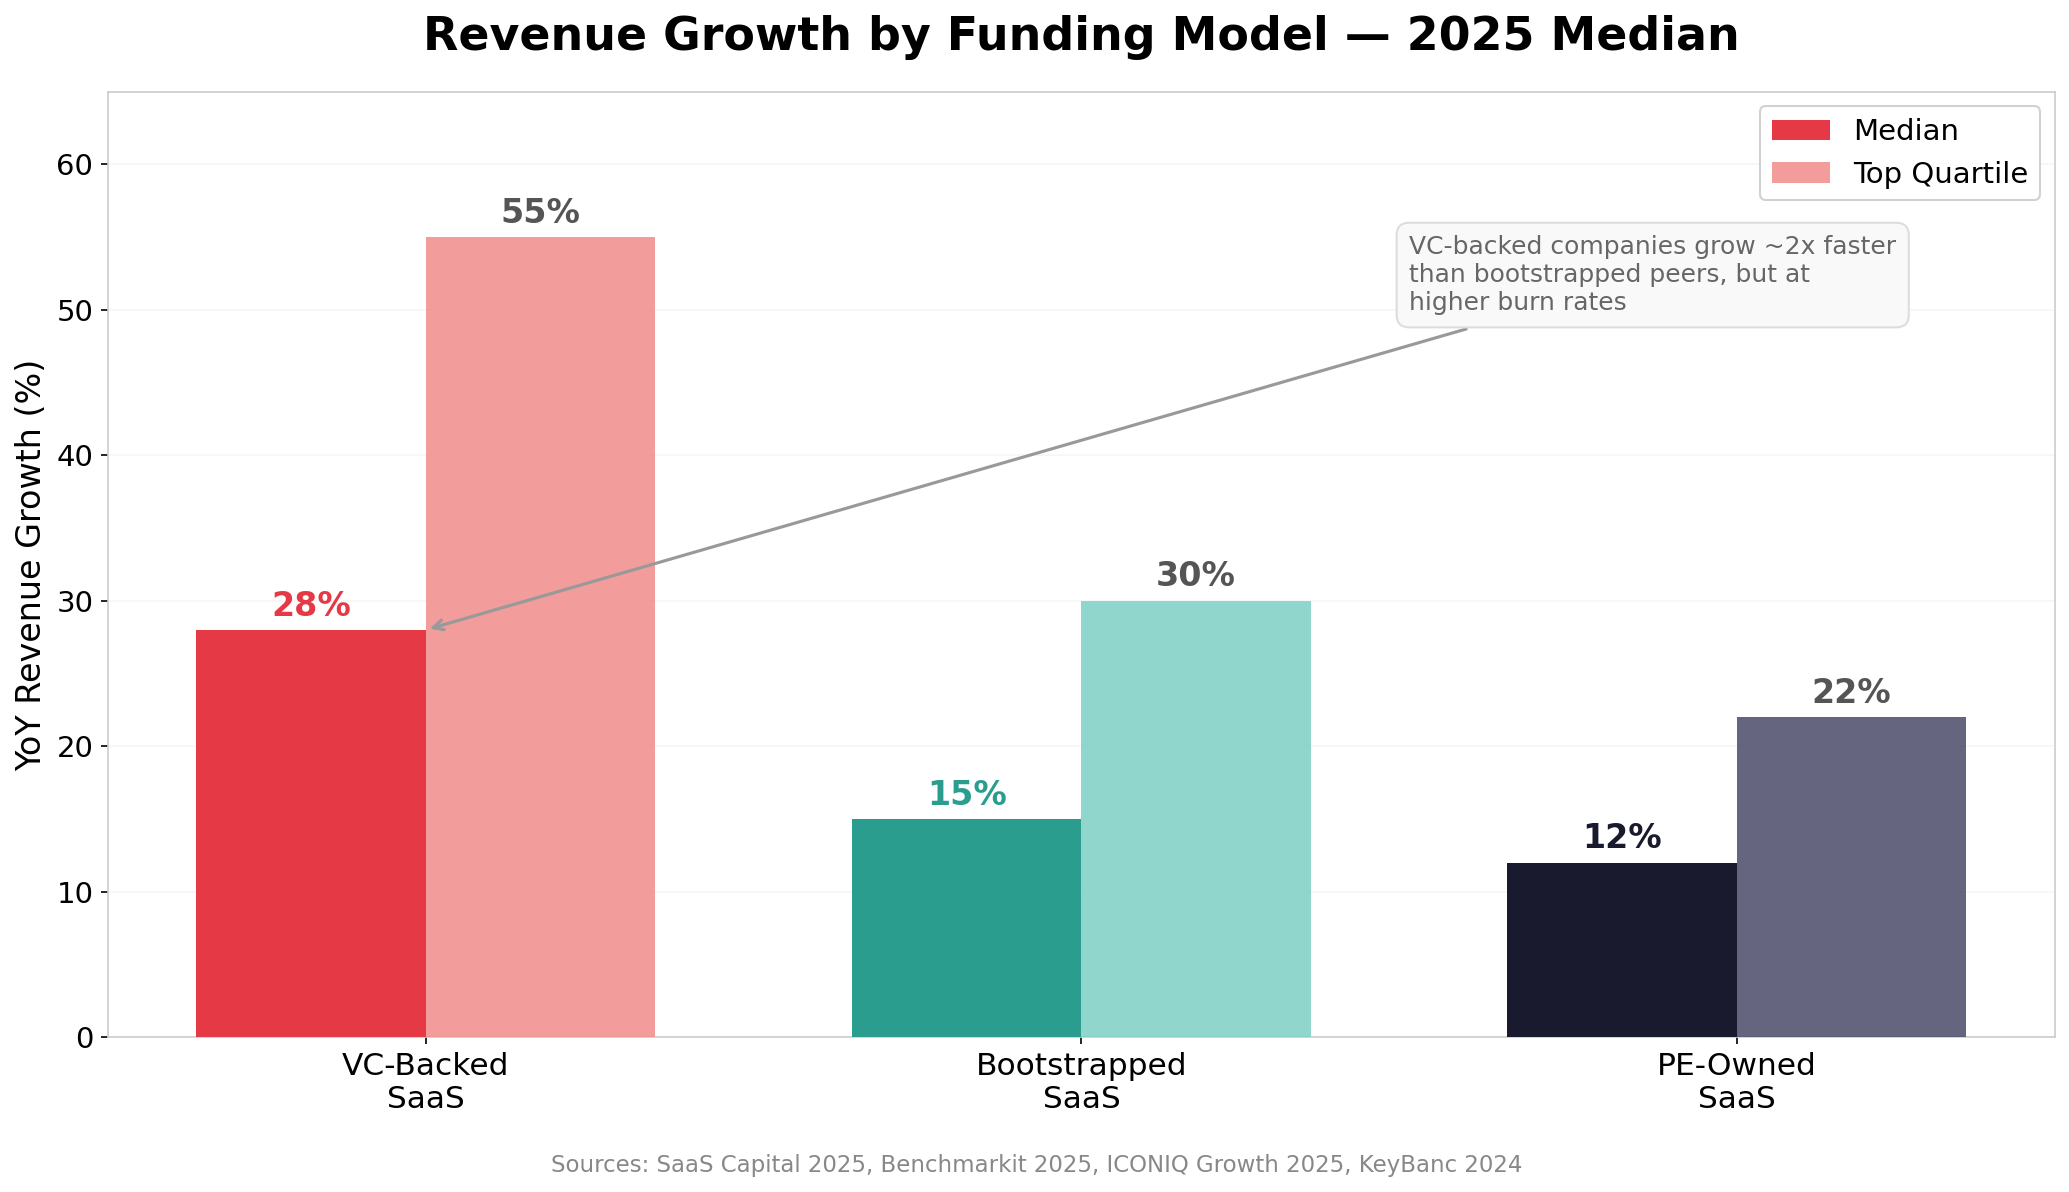
Figure 1c: Revenue growth by funding model — VC-backed companies grow 2x faster than bootstrapped, but at higher burn. Sources: SaaS Capital 2025, Benchmarkit 2025, ICONIQ Growth 2025, KeyBanc 2024
Public SaaS companies, increasingly focused on profitability post-2022, grow at just 17% median — slower than private VC-backed peers but faster than PE-owned SaaS. The "growth at all costs" era has given way to "efficient growth."
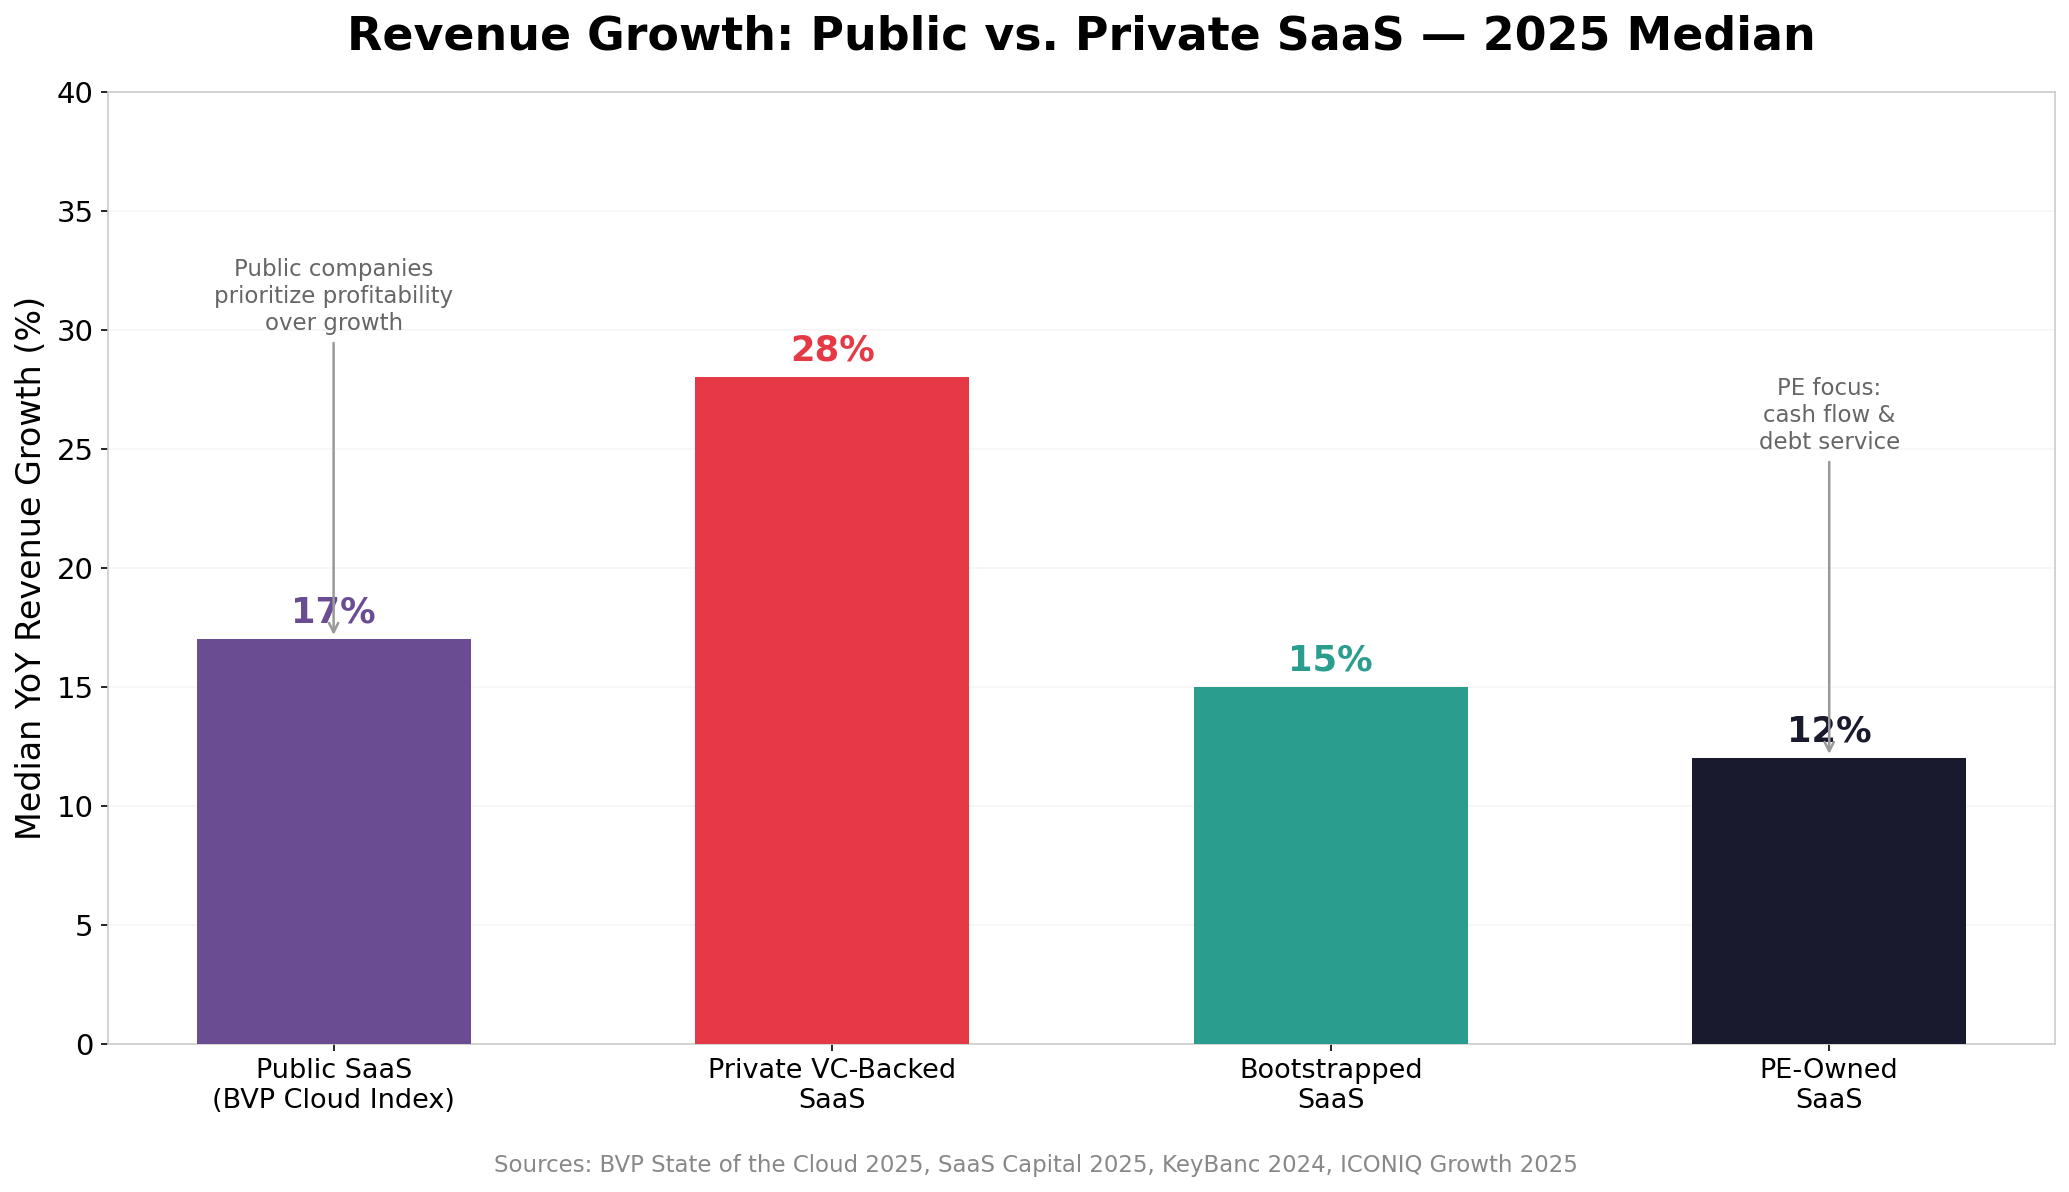
Figure 1d: Public vs. private SaaS growth — public companies prioritize profitability, growing at 17% vs. 28% for VC-backed private. Sources: BVP State of the Cloud 2025, SaaS Capital 2025, ICONIQ Growth 2025
AI is the single biggest growth differentiator in 2025. AI-native companies grow at nearly 4x the rate of legacy SaaS. Even AI-embedded companies (legacy products adding AI features) grow 2x faster than non-AI peers.
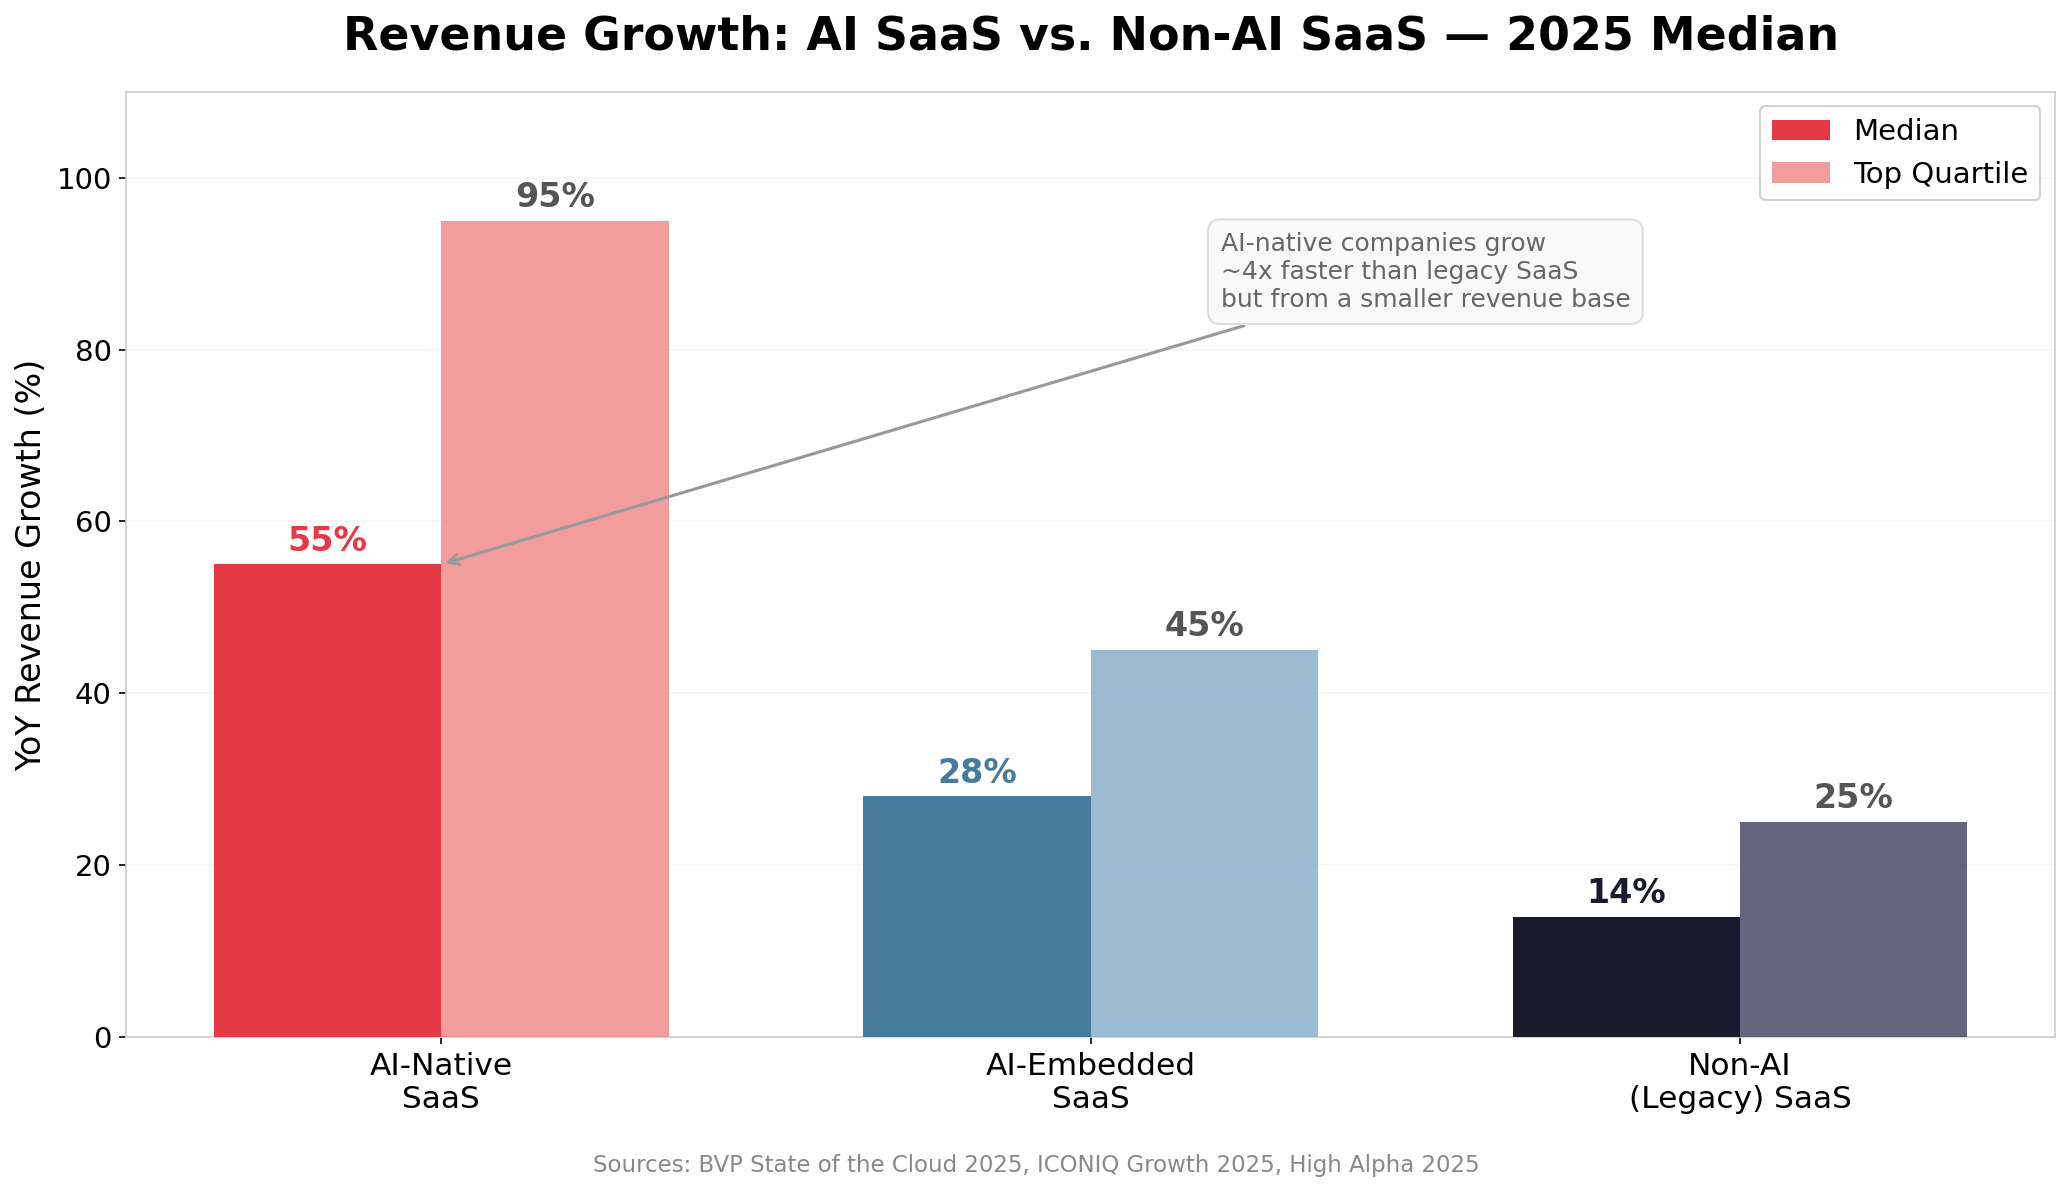
Figure 1e: AI SaaS vs. non-AI SaaS growth — AI-native companies grow 4x faster from a smaller revenue base. Sources: BVP State of the Cloud 2025, ICONIQ Growth 2025, High Alpha 2025
Growth by Market Segment
| Segment | Median Growth | Top Quartile | 90th Percentile | Key Driver |
|---|---|---|---|---|
| SMB (<$10K ACV) | 28% | 65% | 88% | New logo acquisition |
| Mid-Market ($10K–$100K) | 22% | 45% | 60% | Balanced new + expansion |
| Enterprise (>$100K ACV) | 15% | 30% | 42% | Expansion & land-and-expand |
| All Private B2B SaaS | 26% | 50% | 65% | Mixed |
| Bootstrapped ($3–$20M) | 15% | n/a | 42% | Organic growth |
Growth by ARR Band
Growth rates decline predictably as companies scale. The most dramatic slowdown occurs between the $5M and $20M ARR bands, where companies transition from product-led acquisition to sales-assisted motions.
| ARR Band | Median Growth (2025) | vs. Prior Year | Key Note |
|---|---|---|---|
| $1–$5M | 45% | ↓ from 55% | Largest absolute decline YoY |
| $5–$20M | 28% | ↓ from 35% | Sales motion transition zone |
| $20–$50M | 22% | Stable | Expansion becomes dominant |
| $50–$100M | 18% | Stable | Expansion = 58% of new ARR |
| >$100M | 15% | Stable | Expansion = 67% of new ARR |
💡 Key Insight: The growth deceleration is real but stabilizing. Companies above $20M ARR showed essentially flat median growth rates year-over-year, suggesting a new “steady-state growth era” in which efficiency gains compound. Planned growth rates (35% median for 2025) continue to exceed actual results by approximately 9 percentage points — a pattern now in its third consecutive year.
3. Annual Net Revenue Retention (Annual NRR)
Annual Net Revenue Retention (Annual NRR) — how much recurring revenue you keep and grow from your existing customer base over a 12-month period — is arguably the single most important SaaS metric. KeyBanc’s 2025 survey found that Annual NRR correlates most strongly with both valuation multiples and fundraising success. Below 105% Annual NRR, almost nothing else compensates in investor conversations.
Enterprise companies with ACVs above $50K retain and expand at 115% Annual NRR (median), while SMB companies with ACVs below $5K struggle to reach 100%.
📊 Monthly NRR vs. Annual NRR: Why the Distinction Matters
NRR can be expressed on a monthly or annual basis, and the difference is dramatic due to compounding. A seemingly healthy 99% monthly NRR compounds to just ~89% annually (0.9912 = 0.886), meaning you lose 11% of your revenue base each year. Conversely, 101% monthly NRR compounds to ~113% annually (1.0112 = 1.127). The table below shows the conversion:
| Monthly NRR | Annual NRR | Interpretation |
|---|---|---|
| 97% | 69% | Severe revenue erosion — losing ~31% of ARR per year |
| 98% | 78% | Significant contraction — losing ~22% of ARR per year |
| 99% | 89% | Moderate contraction — losing ~11% of ARR per year |
| 99.5% | 94% | Mild contraction — losing ~6% per year |
| 100% | 100% | Breakeven — no net change |
| 100.5% | 106% | Mild expansion — growing 6% from existing base |
| 101% | 113% | Healthy expansion — growing 13% from existing base |
| 102% | 127% | Strong expansion — growing 27% from existing base |
All NRR and GRR figures in this report are expressed on an annual basis (i.e., the percentage of beginning-of-year ARR retained and expanded after 12 months). Most major SaaS benchmark surveys (SaaS Capital, Benchmarkit, KeyBanc, ChurnZero) also report on an annual basis. When sourcing NRR data from tools like ChartMogul or Baremetrics that may display monthly figures, multiply: Annual NRR = (Monthly NRR)12.
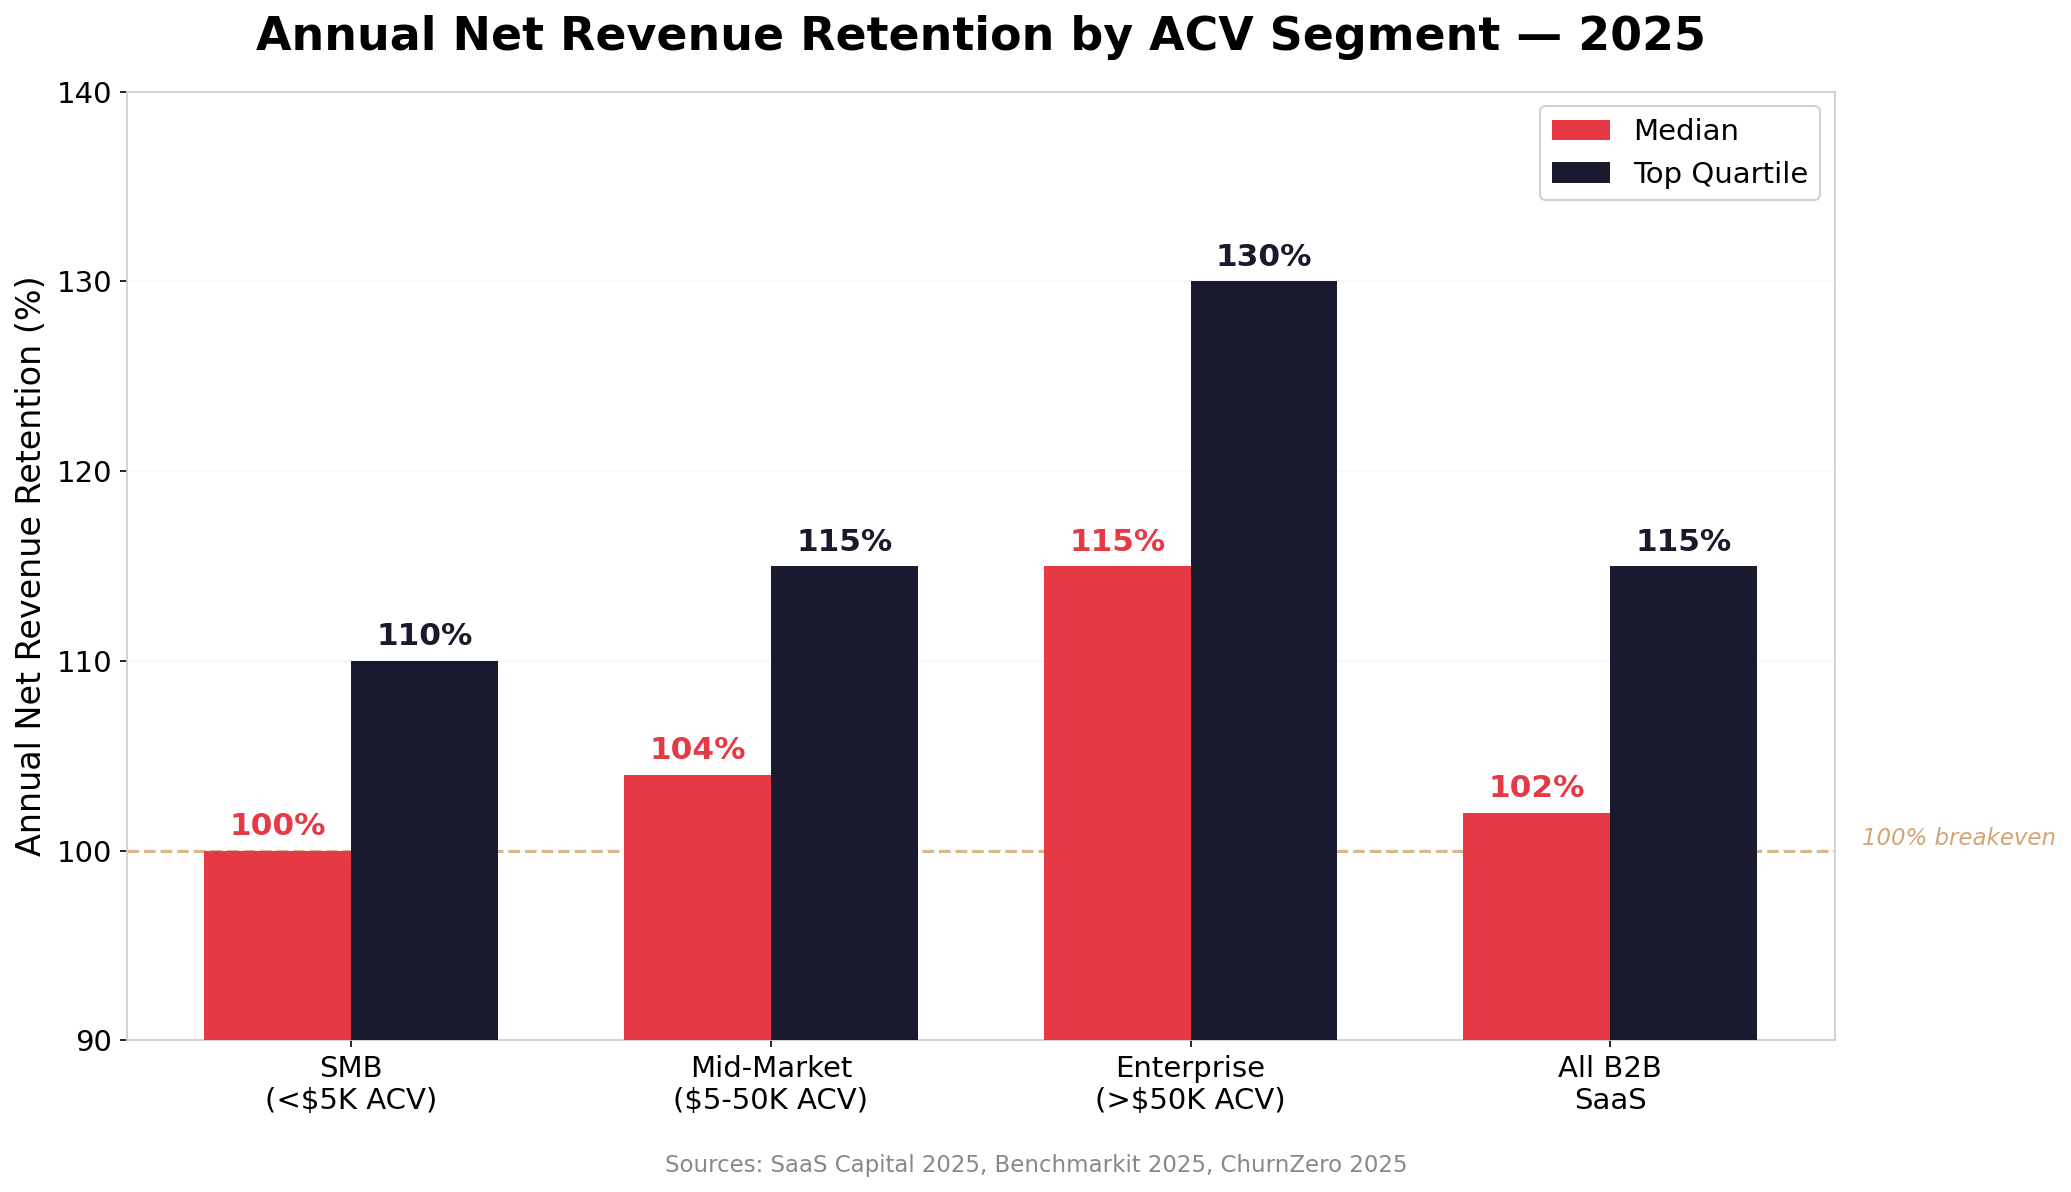
Figure 2a: Annual Net Revenue Retention by ACV segment — enterprise companies expand at 115% median. Sources: SaaS Capital 2025, Benchmarkit 2025, ChurnZero 2025
The broader trend tells a story of industry-wide compression. Annual NRR peaked at approximately 105% in 2021 (Benchmarkit), then declined steadily as budget scrutiny increased.
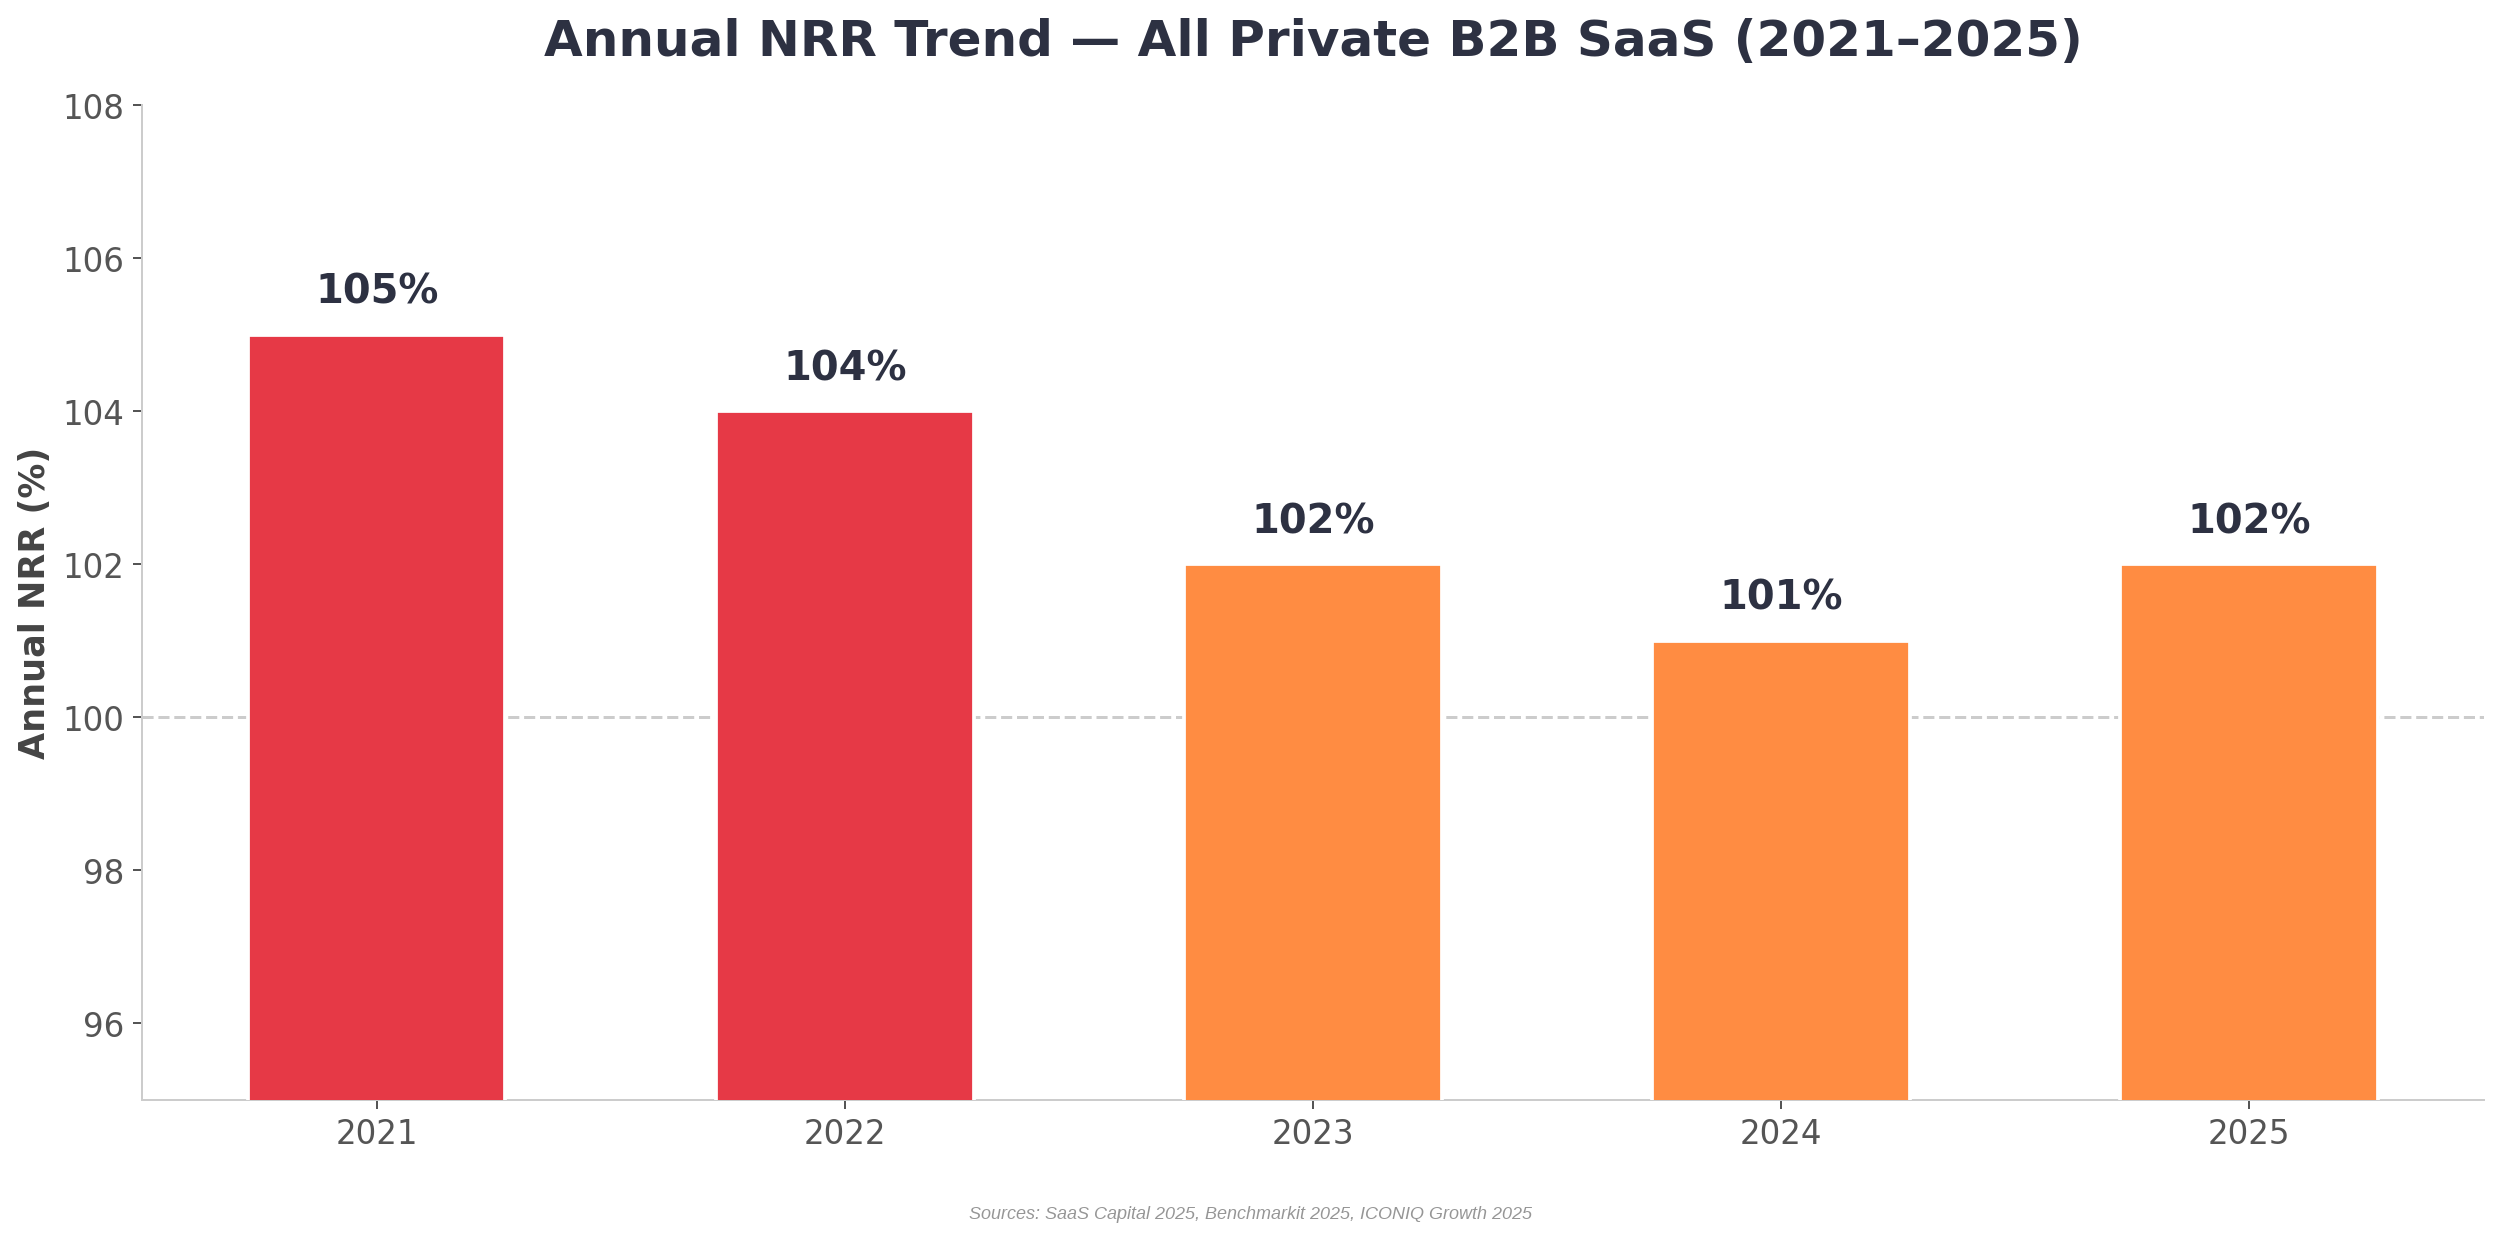
Figure 2b: Annual NRR trend 2021–2025 — three-year compression appears to have stabilized. Sources: SaaS Capital 2025, Benchmarkit 2025, ICONIQ Growth 2025
Annual NRR by ACV Segment
| Segment | Median Annual NRR | Top Quartile | Median Annual GRR | Expansion as % of New ARR |
|---|---|---|---|---|
| SMB (<$25K ACV) | 97% | 105% | 82% | 25% |
| Mid-Market ($25K–$100K) | 108% | 115% | 88% | 38% |
| Enterprise (>$100K ACV) | 118% | 130% | 95% | 55% |
| All Private B2B SaaS | 101% | 120% | 88% | 40% |
The Annual NRR trend over recent years tells a clear story of compression followed by stabilization:
Annual NRR Trend: 2021 → 2025
- 2021: Median Annual NRR ~105% — peak post-COVID expansion
- 2022: Median Annual NRR ~104% — early signs of compression
- 2023: Median Annual NRR ~102% — budget scrutiny begins
- 2024: Median Annual NRR ~101% — third year of decline
- 2025: Median Annual NRR ~101% — stabilization (ChurnZero confirms)
💡 Key Finding: ChurnZero’s 2025 Customer Revenue Leadership Study confirms that Annual NRR and Annual GRR have stabilized after two years of erosion. The study found that the presence of customer enablement, CSMs, support, and account management roles correlates with 4–8 percentage points higher Annual NRR. Teams using a CRM report Annual NRR at 98.5% vs. 90% without; those with a customer success platform achieve 100% Annual NRR vs. 94% without.
4. Account & Revenue Churn
Churn is the silent killer of recurring revenue, and the segment-level differences are staggering. SMB SaaS companies face annual logo churn rates 6–7x higher than enterprise peers — a structural challenge that forces completely different go-to-market strategies.
Logo (account) churn tells the raw story of how many customers leave. Private B2B SaaS companies lose approximately 16% of their customers annually at the median (Lighter Capital 2025). Enterprise companies retain 95%+, while SMB companies face dramatically higher churn rates (see table below).
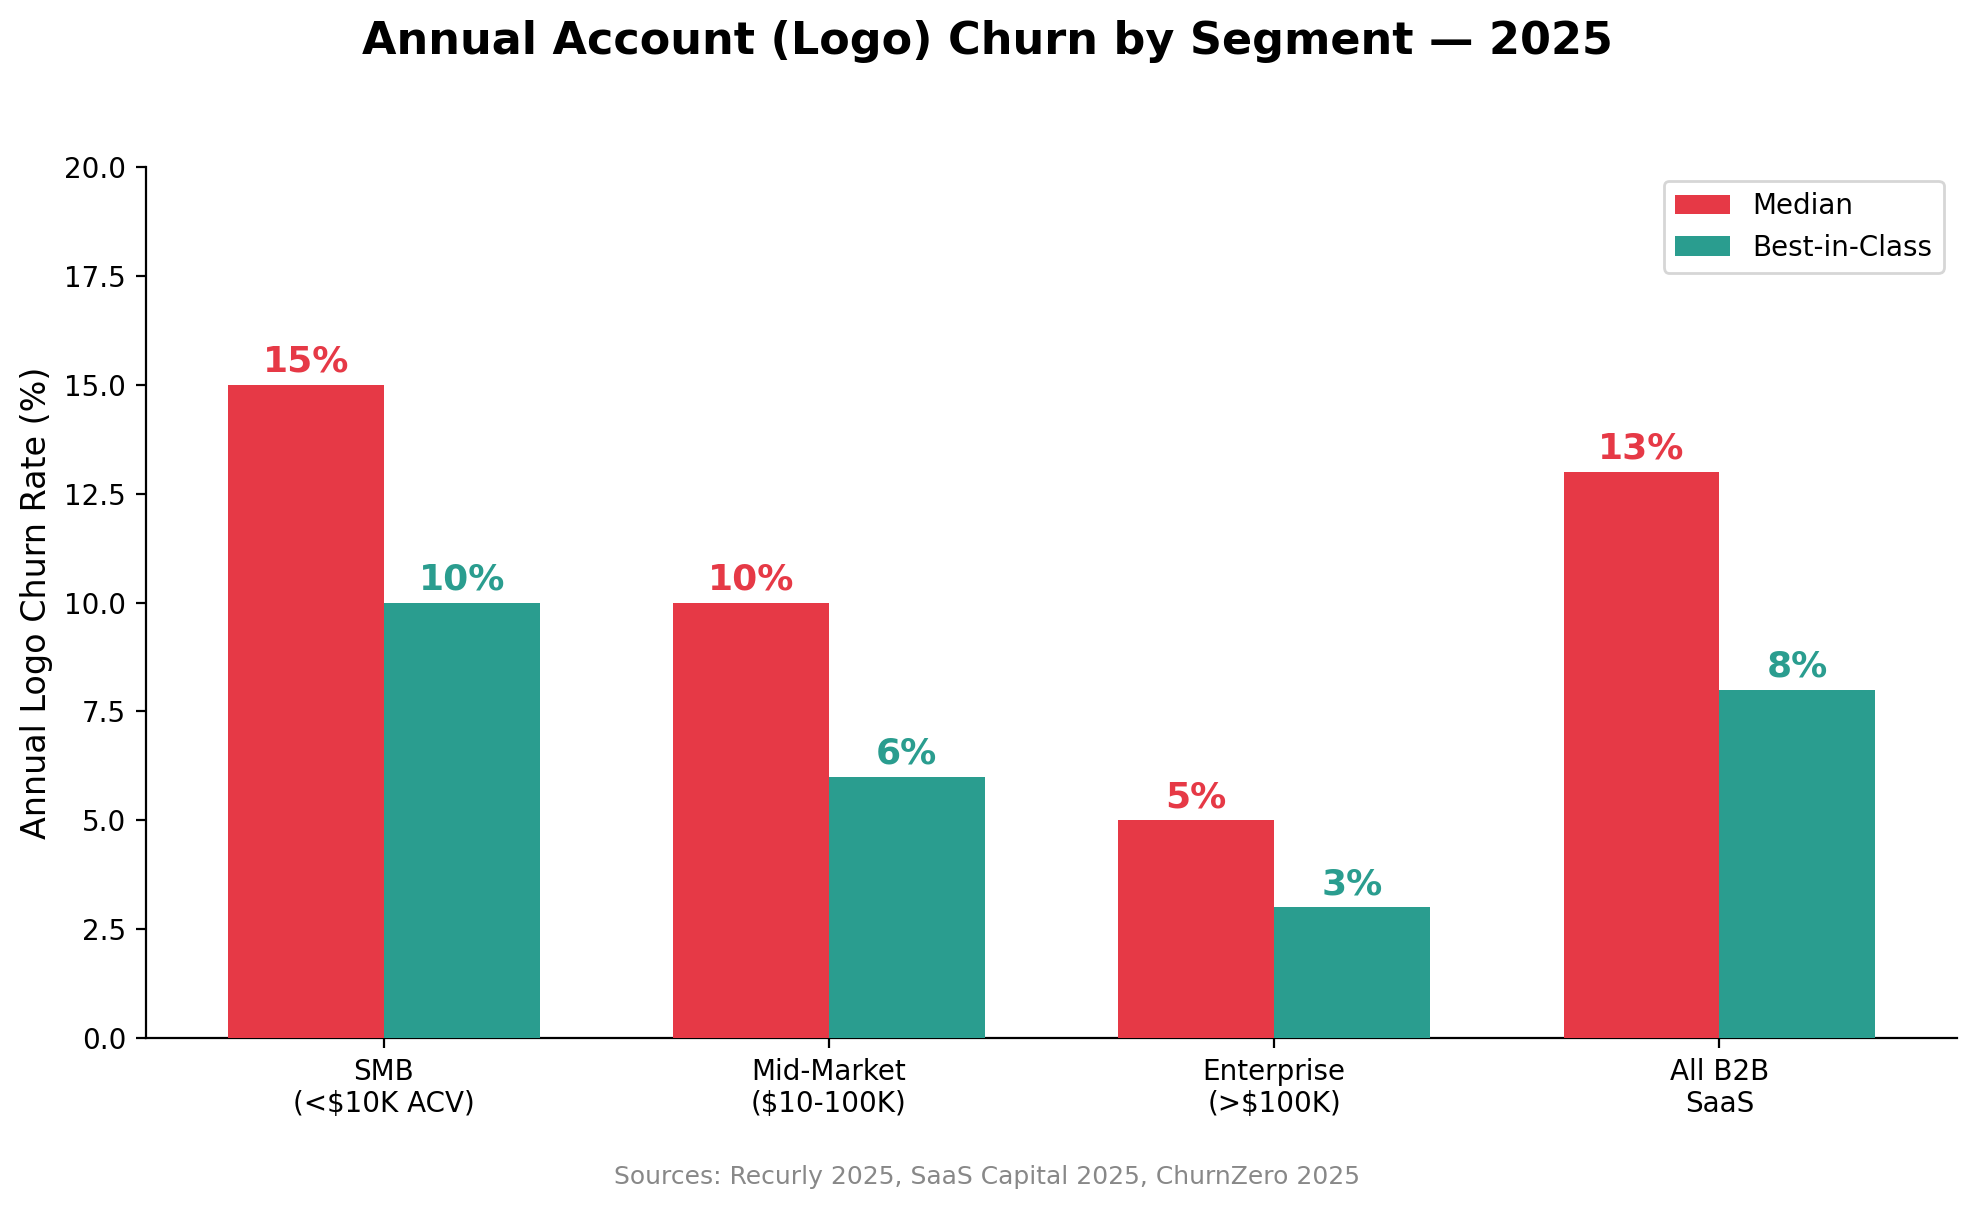
Figure 3a: Annual account (logo) churn by segment — SMB churn is 3x enterprise churn. Sources: SaaS Capital 2025, Recurly 2025, ChurnZero 2025
Revenue churn tells a more nuanced story since it accounts for expansion revenue. Enterprise companies with negative net revenue churn are growing from their existing base alone.
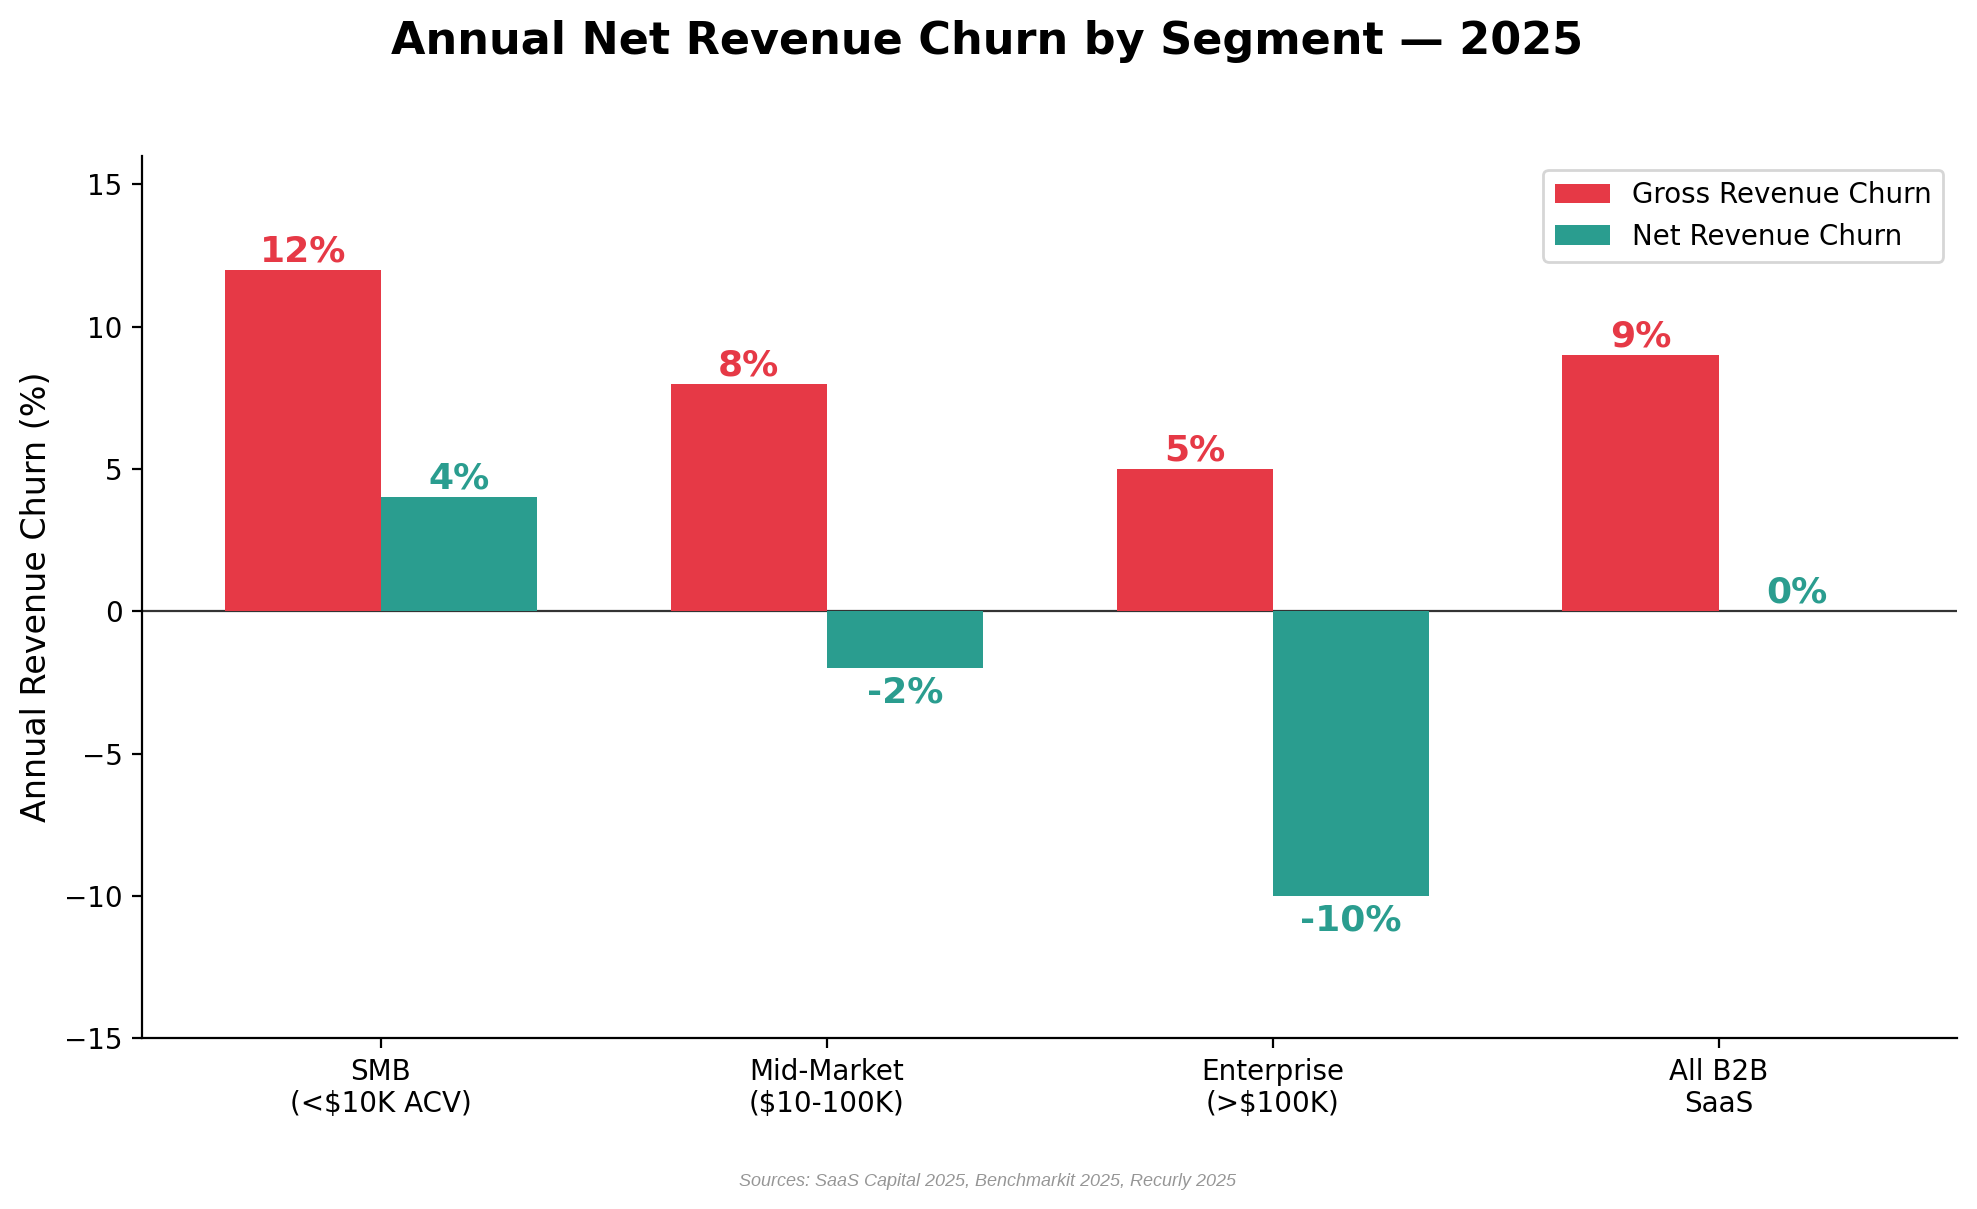
Figure 3b: Gross vs. net revenue churn — enterprise expansion revenue more than offsets churn. Sources: SaaS Capital 2025, Benchmarkit 2025, Recurly 2025
Churn by Market Segment
| Segment | Monthly Logo Churn | Annual Logo Churn | Annual Rev. Churn | Annual GRR |
|---|---|---|---|---|
| SMB (<$5K ACV) | 3–7% | 30–60% | 20–30% | 70–82% |
| Mid-Market ($5K–$50K) | 1–3% | 11–30% | 10–15% | 85–92% |
| Enterprise ($50K+) | <1% | <10% | 3–5% | 93–97% |
| All Private B2B SaaS | ~3.3% | ~16% | ~12.5% | ~88% |
Churn Trends in 2025
Overall SaaS churn ticked up modestly in 2025. Lighter Capital’s analysis of 155 private B2B SaaS startups found median annual revenue churn rising from 11.34% to 12.50%, and median annual customer churn holding steady at 16.25%. However, vertical-specific dynamics drove most of the movement:
🚨 Vertical Churn Outliers in 2025
Education SaaS (EdTech): Customer churn doubled from 11% to 22%, and revenue churn rose 71%. Budget cuts and AI-driven tool substitution hit EdTech particularly hard.
Healthcare SaaS (HealthTech): Revenue churn increased 67%, driven by consolidation among health systems and regulatory compliance complexity.
Financial Services SaaS (FinTech): Achieved the lowest churn rates in the dataset, benefiting from regulatory switching costs, deeply embedded workflows, and payments revenue that reduces price sensitivity.
The gap between logo churn and revenue churn matters. Across all verticals, median customer churn runs at 16.25% while revenue churn is only 12.50% (Lighter Capital 2025). This signals that higher-value customers churn less frequently — and that companies lose more small accounts than large ones.
Benchmark Your SaaS Against the Best
SaasRise members get live benchmarking sessions, peer comparisons, and direct access to 200+ SaaS CEOs scaling from $1M to $100M+ ARR. Apply to join our Growth & Exit Prep Mastermind Community for SaaS CEOs and Founders.
Apply to SaasRise →5. Net Profit & Margin Benchmarks
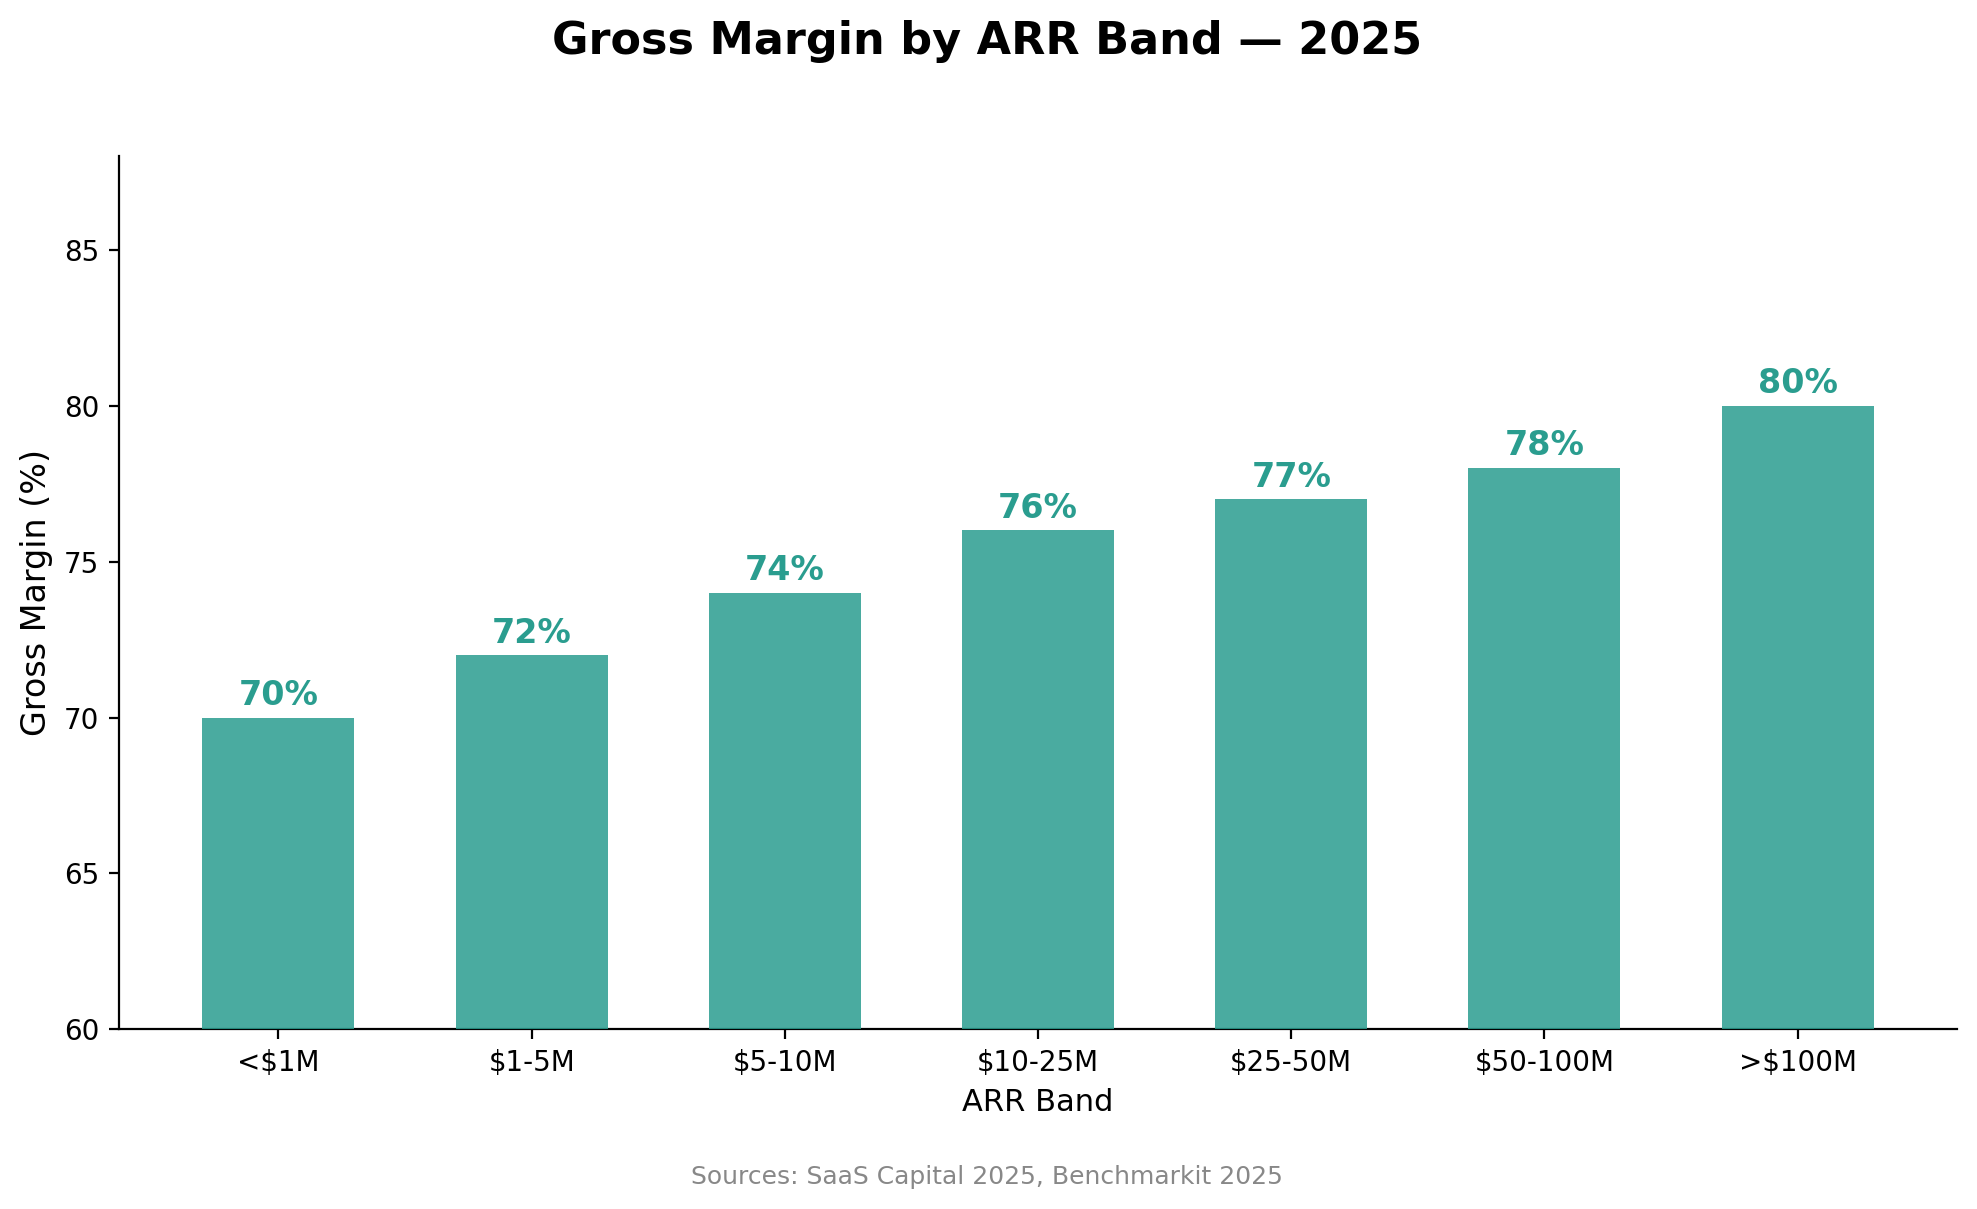
Profitability in SaaS varies enormously by segment, stage, and AI classification. The industry benchmark for subscription gross margin remains 75%, but the range from AI-native companies (55–70%) to enterprise SaaS (80–85%) reflects fundamentally different cost structures.
Gross margins in SaaS are remarkably consistent across segments, clustering around 72–78%. The variation is driven more by business model than by customer size.
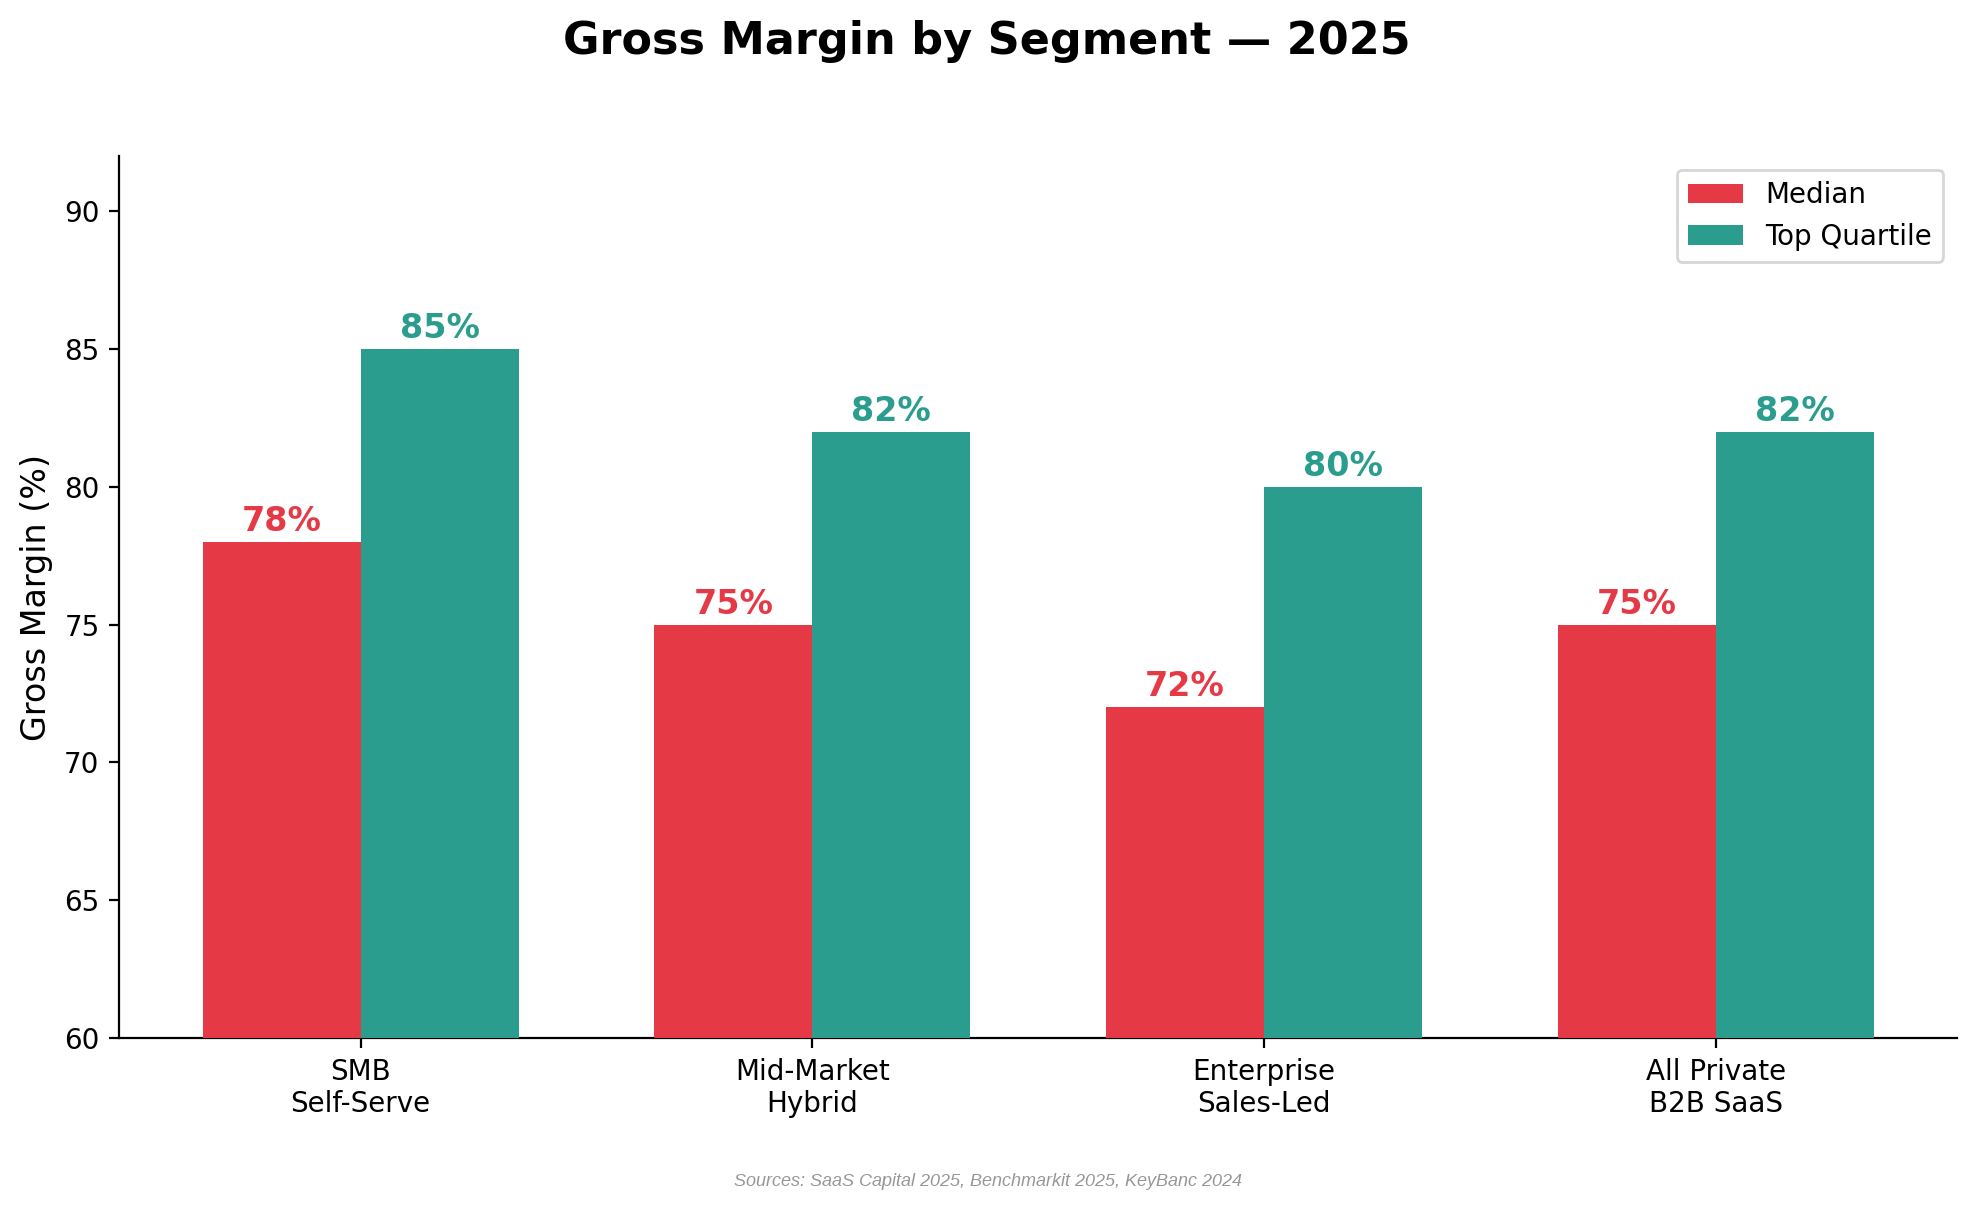
Figure 8a: Gross margin by segment — self-serve SMB achieves highest margins due to lower support costs. Sources: SaaS Capital 2025, Benchmarkit 2025, KeyBanc 2024
Operating margins vary enormously by growth stage. Early-stage companies burn cash to grow, while those above $50M ARR achieve positive operating margins.
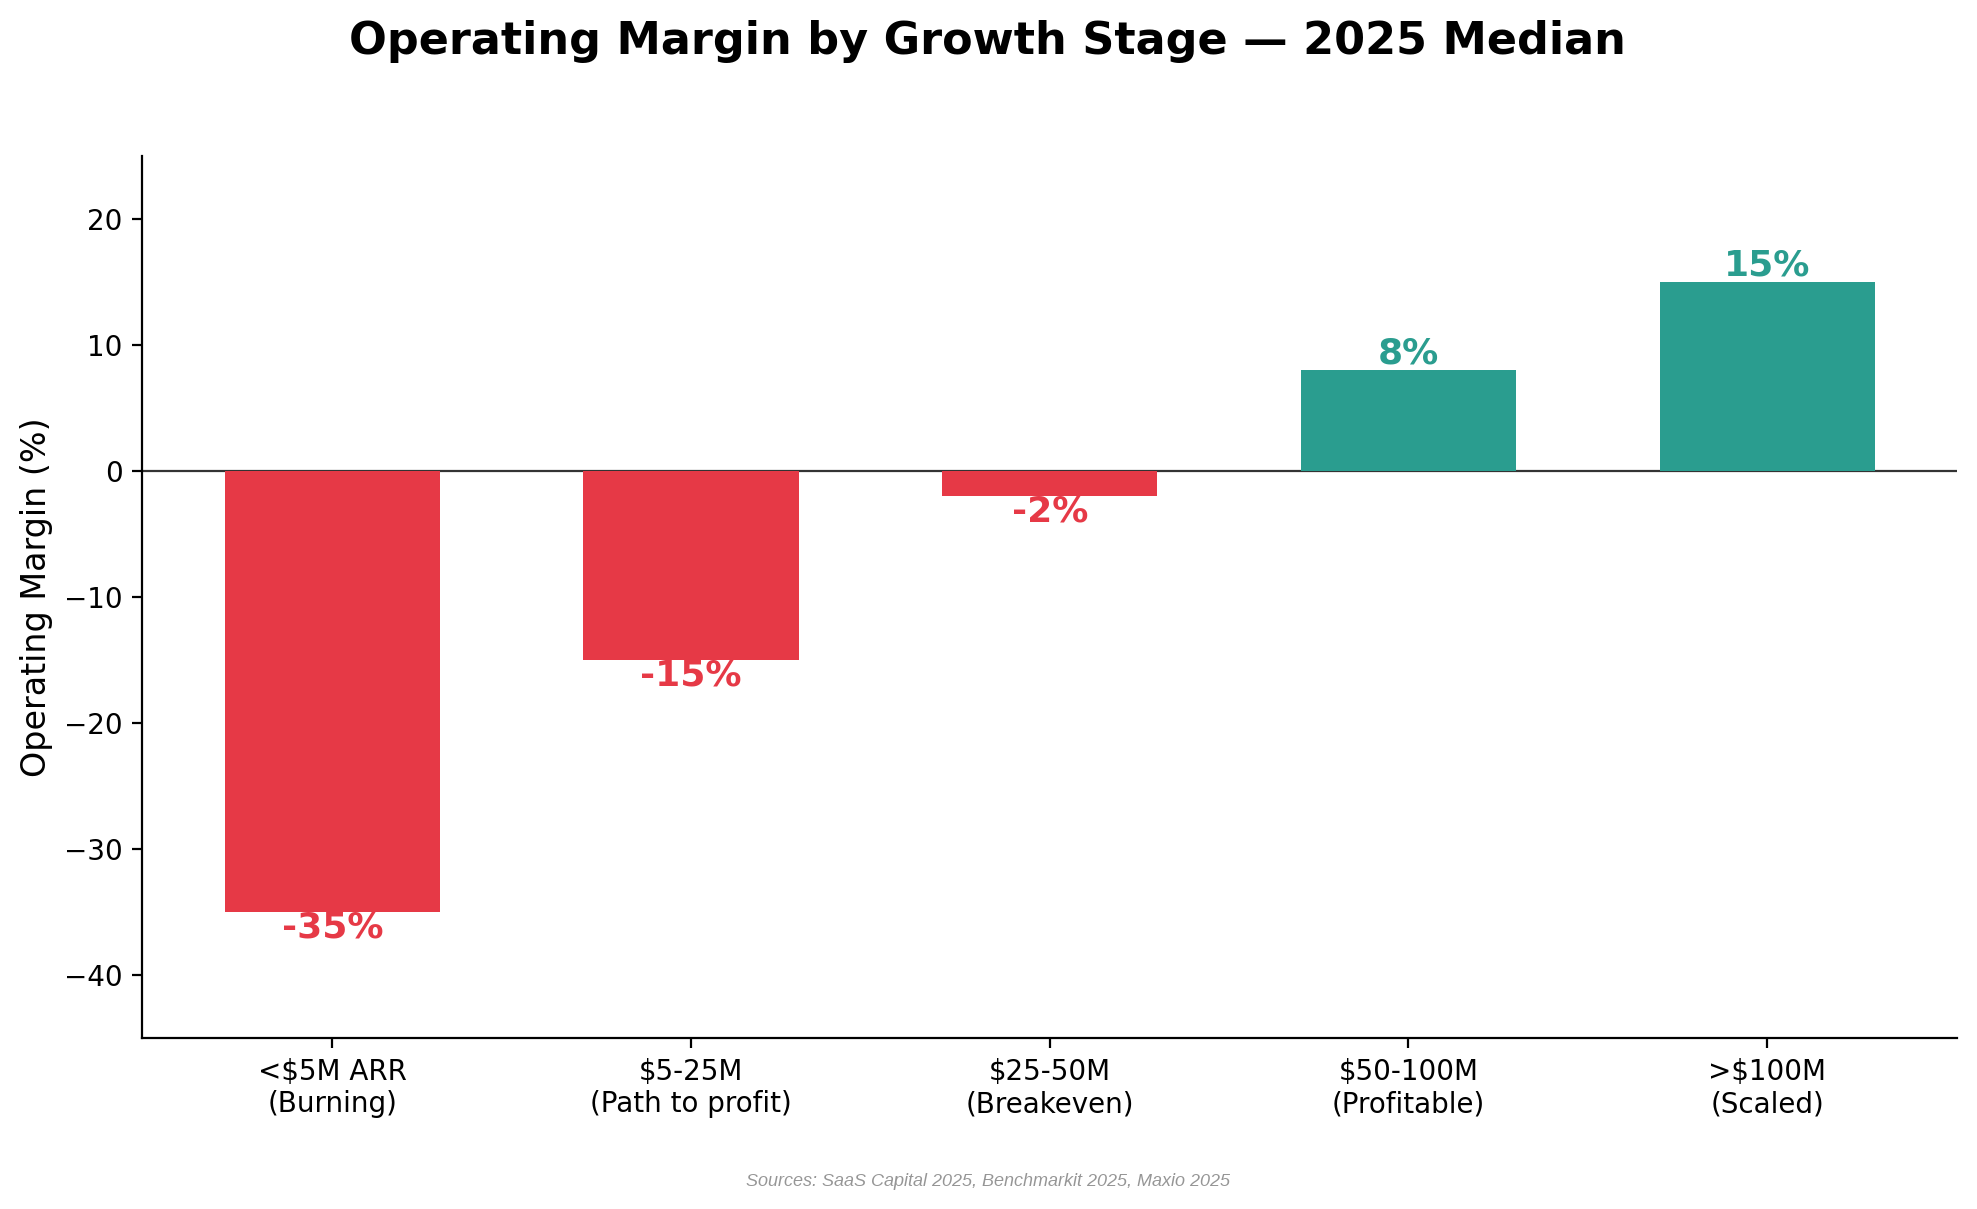
Figure 8b: Operating margin by growth stage — profitability typically emerges between $25M and $50M ARR. Sources: SaaS Capital 2025, Benchmarkit 2025
Margin Benchmarks by Segment
| Segment | Gross Margin | Operating Margin | FCF Margin |
|---|---|---|---|
| Enterprise (>$250K ACV) | 80–85% | 20–30% | 20–30% |
| Mid-Market ($10K–$100K) | 75–80% | 10–20% | 8–15% |
| SMB (<$10K ACV) | 72–78% | 5–15% | 3–10% |
| AI-Native (Compute-Heavy) | 55–70% | Often negative | Often negative |
| Growth-Stage SaaS (All) | ~75% | -15% (median) | Varies |
| Mature SaaS (All) | ~78% | ~20% | ~23% |
💡 Key Insight: AI-native SaaS companies face a unique margin challenge. Compute-heavy inference costs (LLM API calls, GPU infrastructure) push gross margins down to 55–70% — well below the traditional 75%+ SaaS benchmark. This is forcing a rethink of SaaS unit economics: EV/EBITDA multiples (median 26.6x for public SaaS in 2026, per Aventis Advisors) are becoming the relevant valuation metric, replacing EV/Revenue for the first time.
Public SaaS Profitability (2026 Data)
Among the 55 largest public SaaS companies tracked by Aventis Advisors, the aggregate numbers as of early 2026 are:
The gap between EBITDA margin (7.3%) and FCF margin (23.0%) reflects the significant stock-based compensation and non-cash charges that inflate EBITDA-based profitability measures. Only 15% of public SaaS companies (8 of 55) clear the Rule of 40 on an EBITDA basis, while 46% (25 of 55) clear it on an FCF basis.
Net Profit by Funding Model: Bootstrapped vs. VC-Backed vs. PE-Owned vs. Publicly Traded
Profitability varies dramatically by funding model — reflecting fundamentally different strategic priorities. Bootstrapped companies optimize for sustainability; VC-backed companies trade profits for growth; PE-owned companies are engineered for cash flow; and public companies have recently crossed into profitability after years of losses.
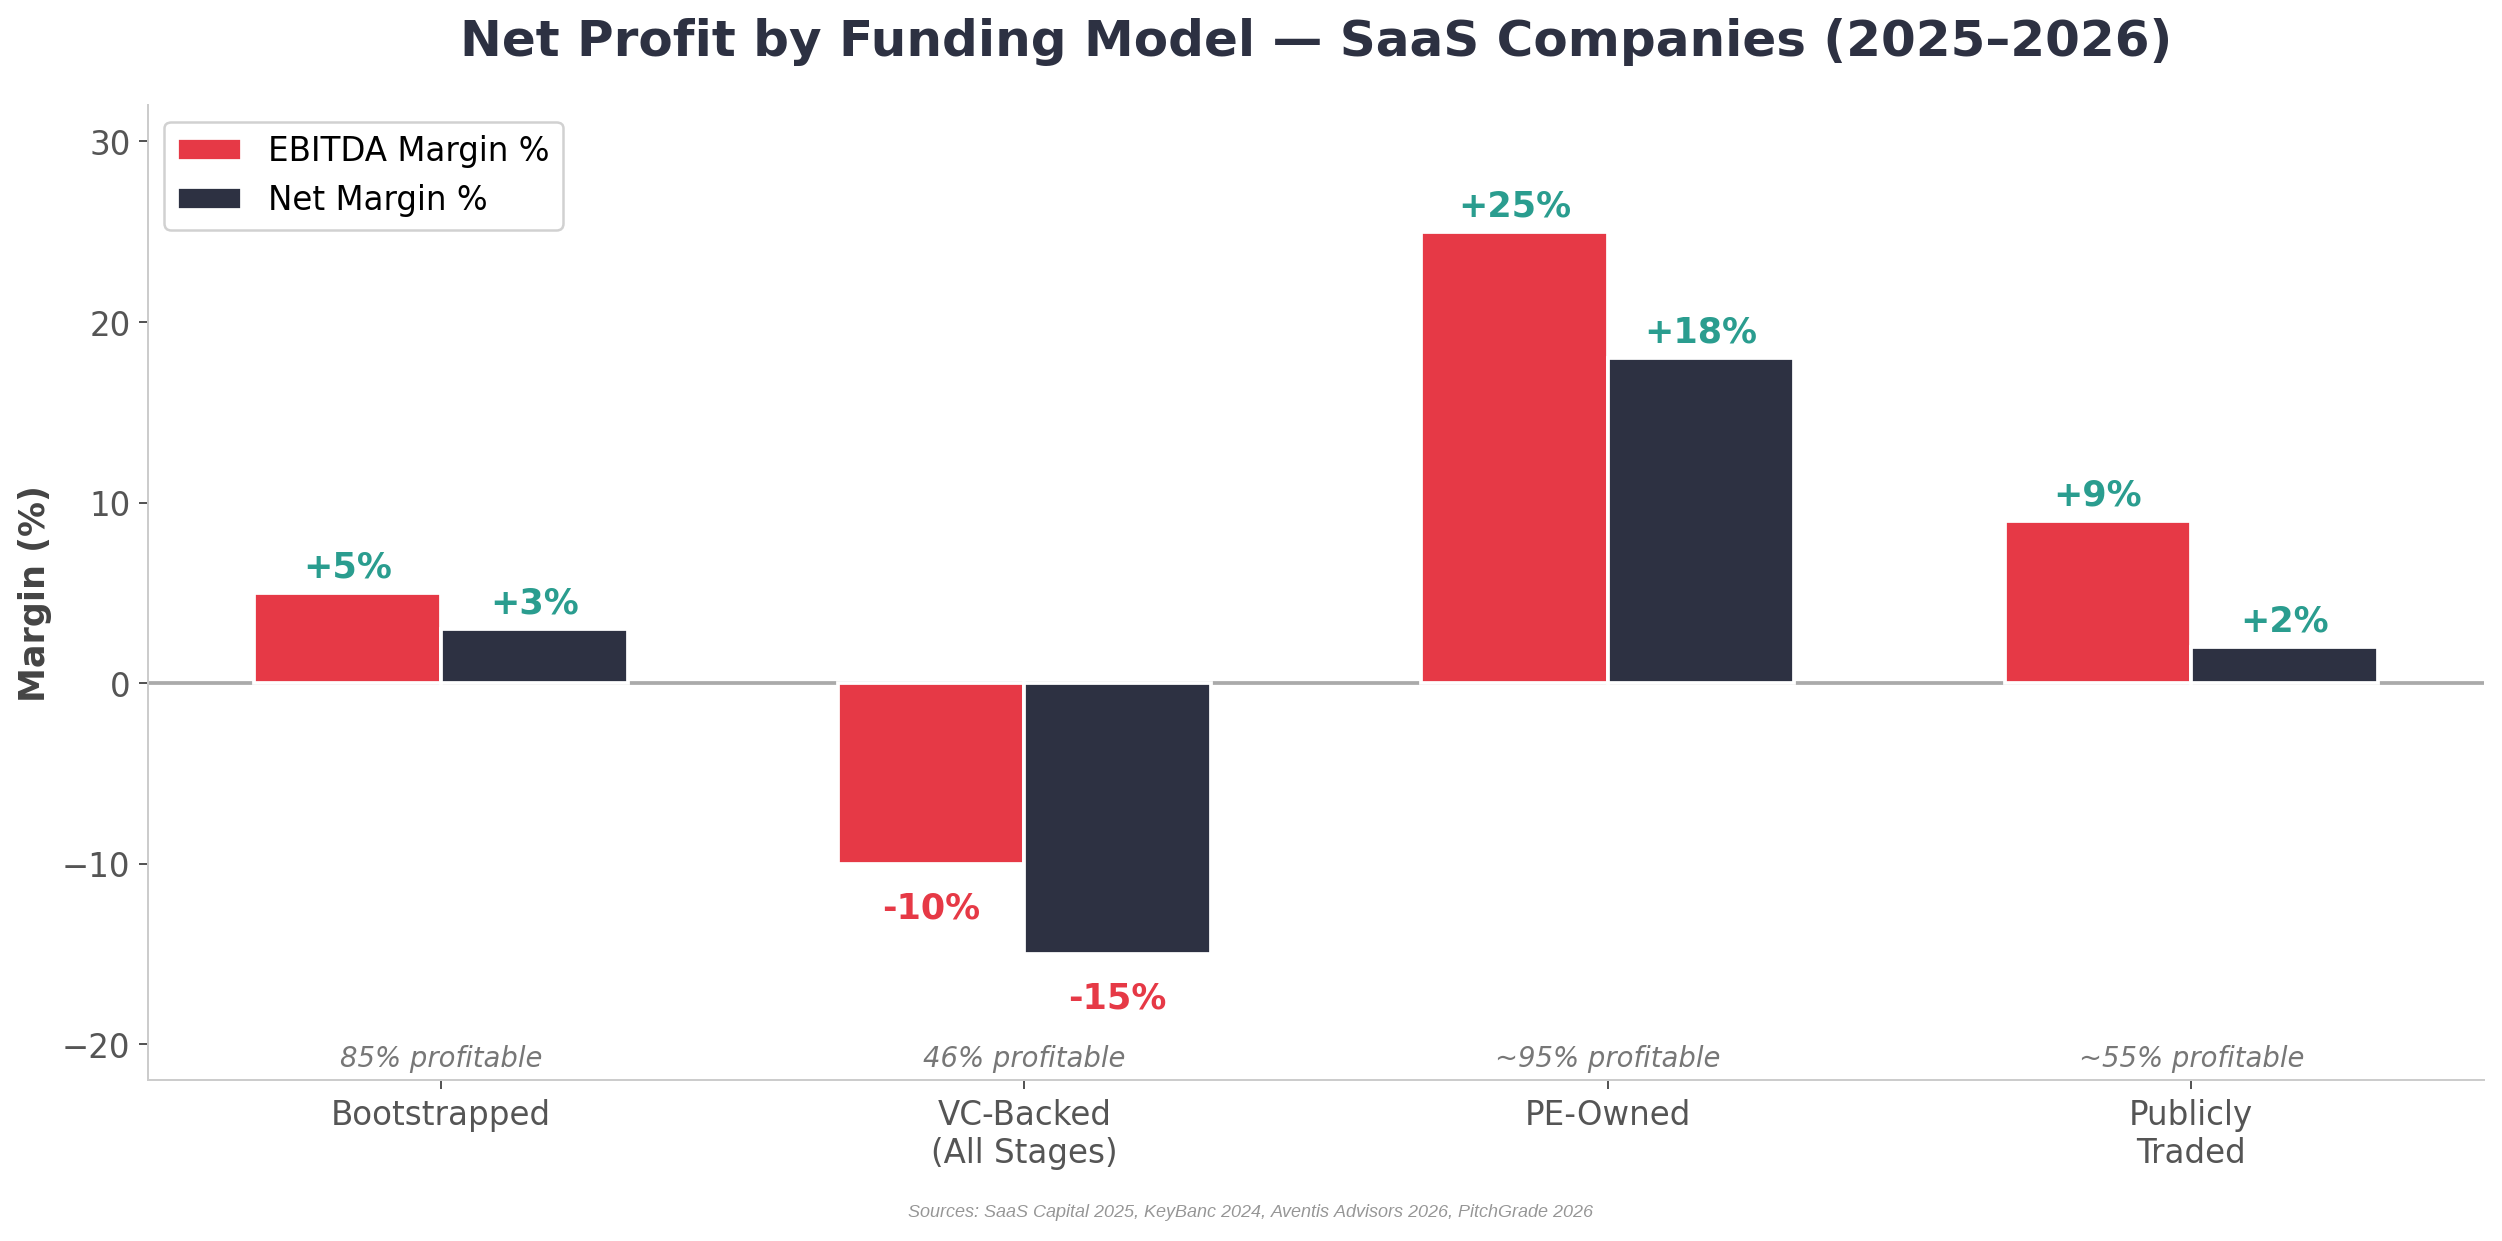
Figure 8c: Net profit by funding model — PE-owned SaaS leads on profitability, while VC-backed companies remain in the red. Sources: SaaS Capital 2025, KeyBanc 2024, Aventis Advisors 2026, PitchGrade 2026
| Funding Model | Median EBITDA Margin | Est. Net Margin | % Profitable | Total Spend (% of ARR) | Key Characteristic |
|---|---|---|---|---|---|
| Bootstrapped | +5% | +3% | 85% | 95% | Lean ops, sustainable by design |
| VC-Backed (All Stages) | −10% | −15% | 46% | 107% | Growth over profit; burning cash |
| PE-Owned | +25% | +18% | ~95% | ~70–75% | Optimized for EBITDA & debt service |
| Publicly Traded | +9% | +2% | ~55% | ~90% | Recently profitable; SBC inflates gap |
💡 The Profitability Spectrum:
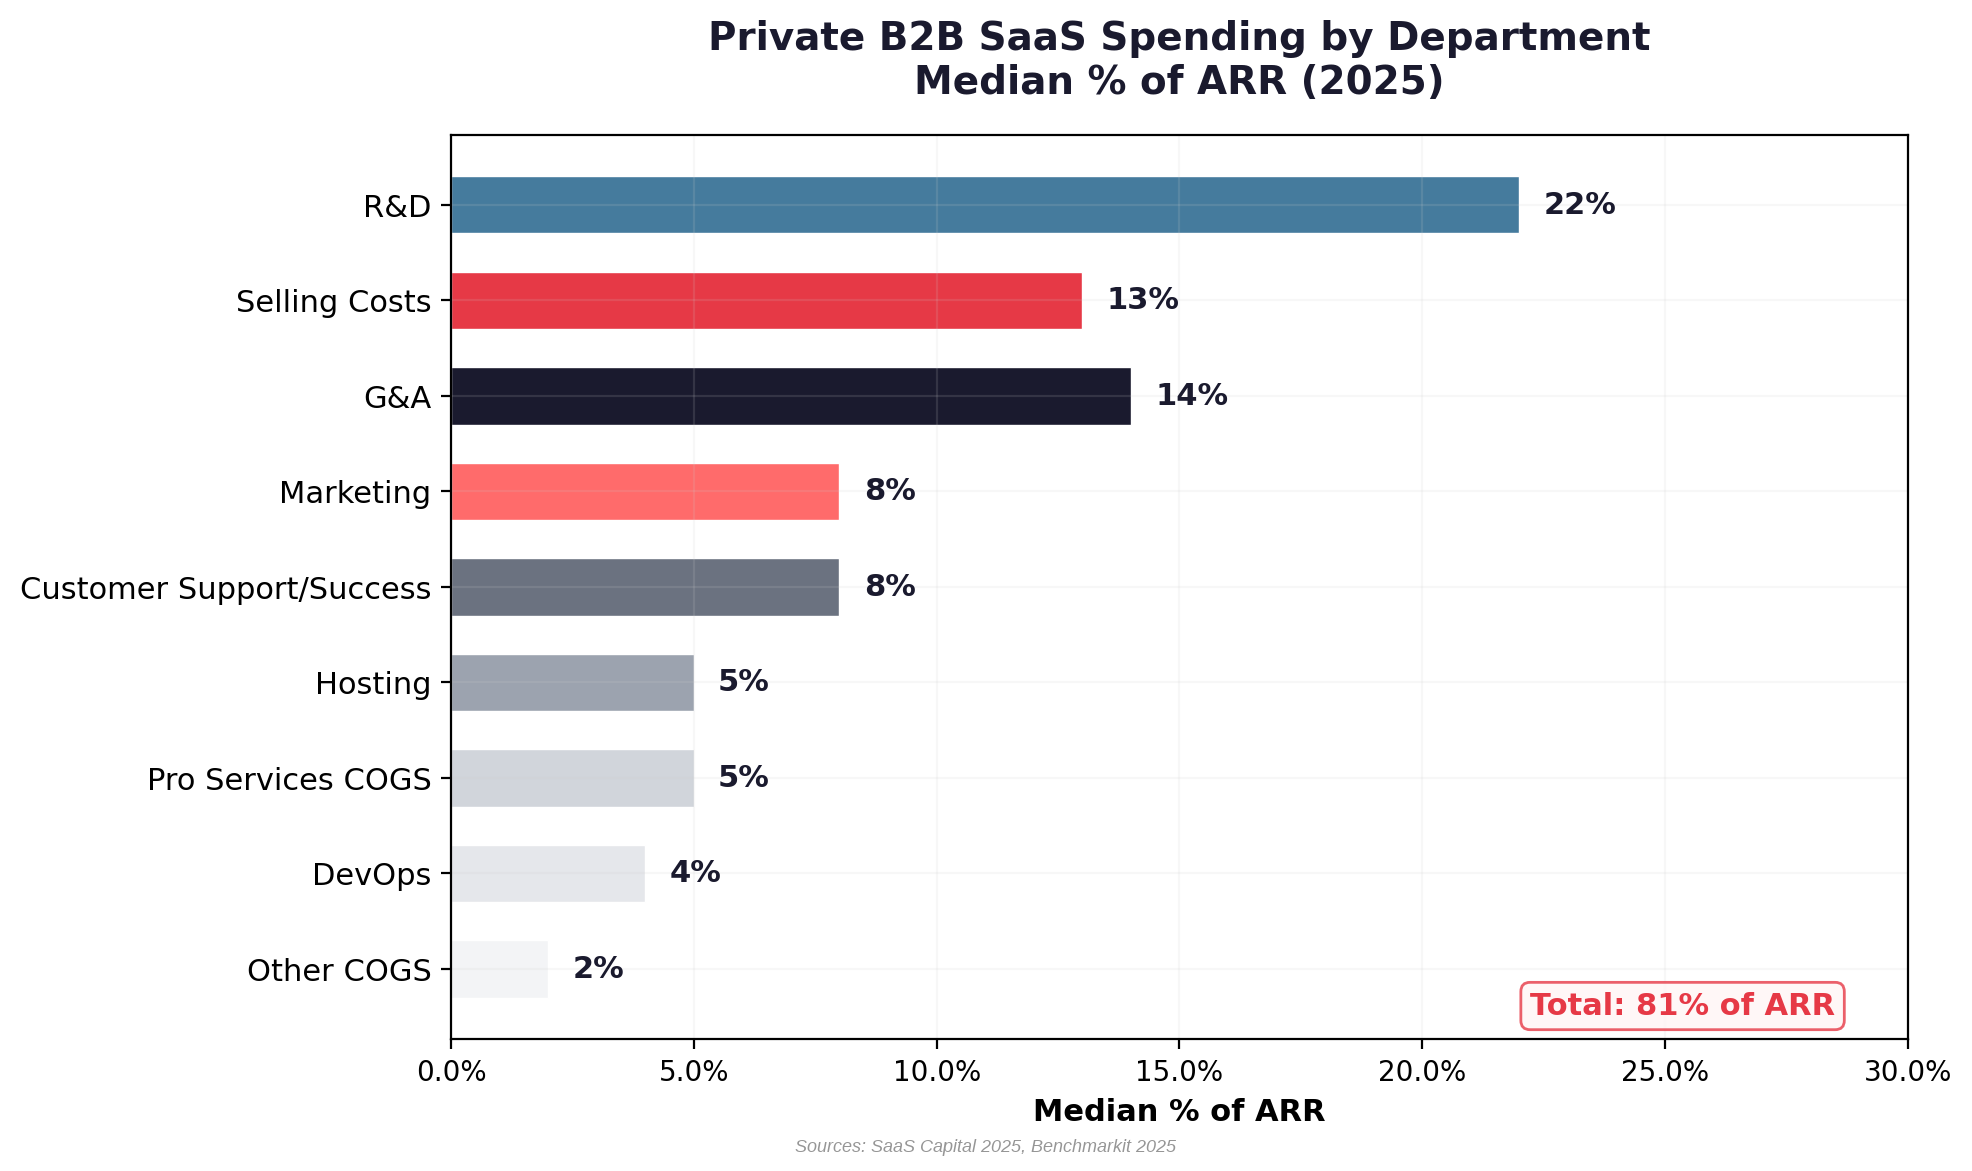
- Bootstrapped SaaS spends 95% of ARR (median), leaving ~5% EBITDA margin. 85% of bootstrapped companies are at or near breakeven/profitable vs. only 46% of equity-backed (SaaS Capital 2025). They spend 89% less on sales, 100% less on marketing, and 80% less on G&A than equity-backed peers.
- VC-Backed SaaS spends 107% of ARR, operating at a median −10% EBITDA margin. KeyBanc’s 2024 survey shows median EBITDA of −6% (2024E), improved from −26% in 2022. The 55% of equity-backed companies running at a loss are not buying proportionally more growth — they are running less efficiently (SaaS Capital 2025).
- PE-Owned SaaS targets 20–30% EBITDA margins through aggressive cost optimization. PE acquirers typically add 15–25 percentage points of EBITDA margin in year one post-acquisition through headcount rationalization, pricing discipline, and operational efficiency. At exit, they sell at 15–25x EBITDA to strategic buyers.
- Public SaaS crossed into positive EBITDA territory (median 9.3%) and net income (median +1.6%) for the first time in Q3 2025 (Aventis Advisors 2026). The wide gap between EBITDA (9%) and FCF (18–23%) reflects heavy stock-based compensation.