

The Science of SaaS Unit Economics: How to Nail Your Numbers and Scale with Confidence
When SaaS companies hit $3–10M ARR and stop growing, it’s rarely because of product issues. More often, the problem is mathematical — they don’t understand their unit economics well enough to scale confidently.

If you don’t know how much you can afford to spend to acquire a customer, you’ll either overspend and burn cash, or underspend and stall growth.
Mastering CAC (Customer Acquisition Cost), LTV (Lifetime Value), and your payback period gives you a clear path to scale. It’s how you turn growth from guesswork into a repeatable, data-driven process.
This content is from the 16 week B2B SaaS Growth Program that we run twice a year.
Why Unit Economics Matter
Unit economics are the foundation of predictable SaaS growth. They tell you, at a customer level, whether your business model is profitable and scalable.
Founders often struggle here because they don’t know what to measure or how to interpret the data. Without clear numbers, it’s nearly impossible to:
- Confidently set marketing and sales budgets
- Identify profitable acquisition channels
- Justify raising or reinvesting capital
- Avoid the “churn plateau” where growth flatlines
Once you understand these metrics, you’ll know how to trade $1 in acquisition cost for $5–8 in lifetime revenue — sustainably.
The Five Core SaaS Metrics
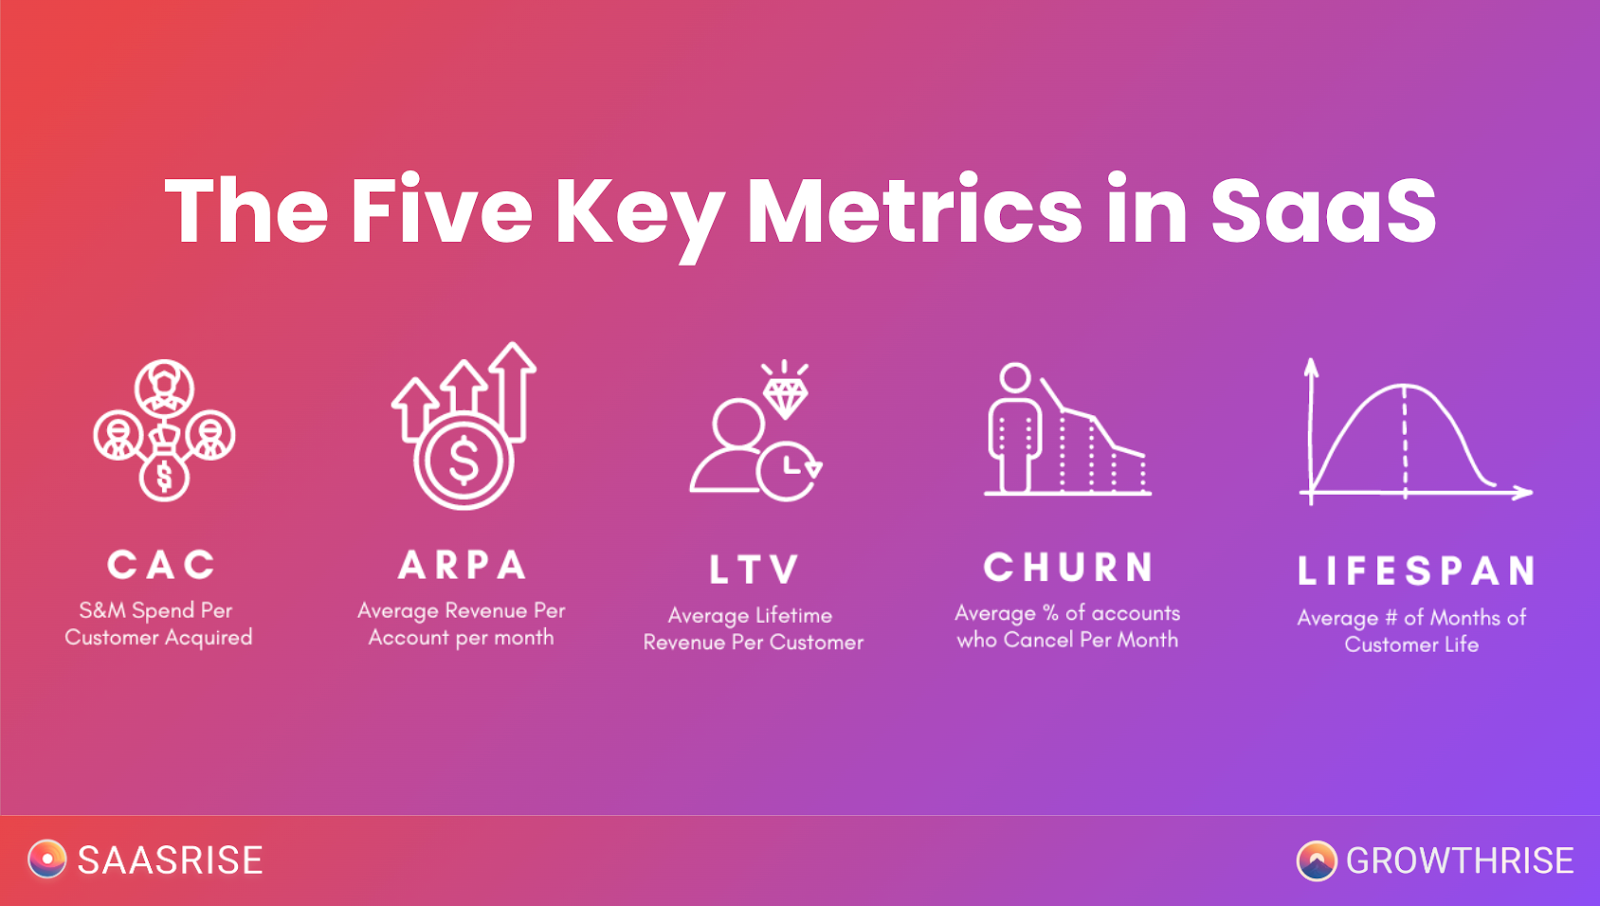
Every recurring-revenue company should track these five numbers closely:
- CAC (Customer Acquisition Cost) — Total sales and marketing spend divided by new customers acquired.
- ARPA (Average Revenue Per Account) — Average monthly revenue per customer.
- LTV (Lifetime Value) — Total revenue from a customer over their entire lifespan (ARPA × lifespan).
- Churn Rate — Percentage of customers that cancel in a given month.
- Lifespan — Average customer lifetime in months (1 ÷ monthly churn).
These five inputs determine your two most important outputs:
- LTV:CAC Ratio — Efficiency of your growth engine
- Payback Period — How long it takes to recover acquisition costs
When you know these numbers, scaling becomes mathematical — not emotional.
How to Calculate Each Metric
1. Customer Acquisition Cost (CAC)
There are two versions:
- Ad CAC: Ad spend ÷ new customers attributed to ads
- Overall CAC: Total sales & marketing expenses ÷ total new customers
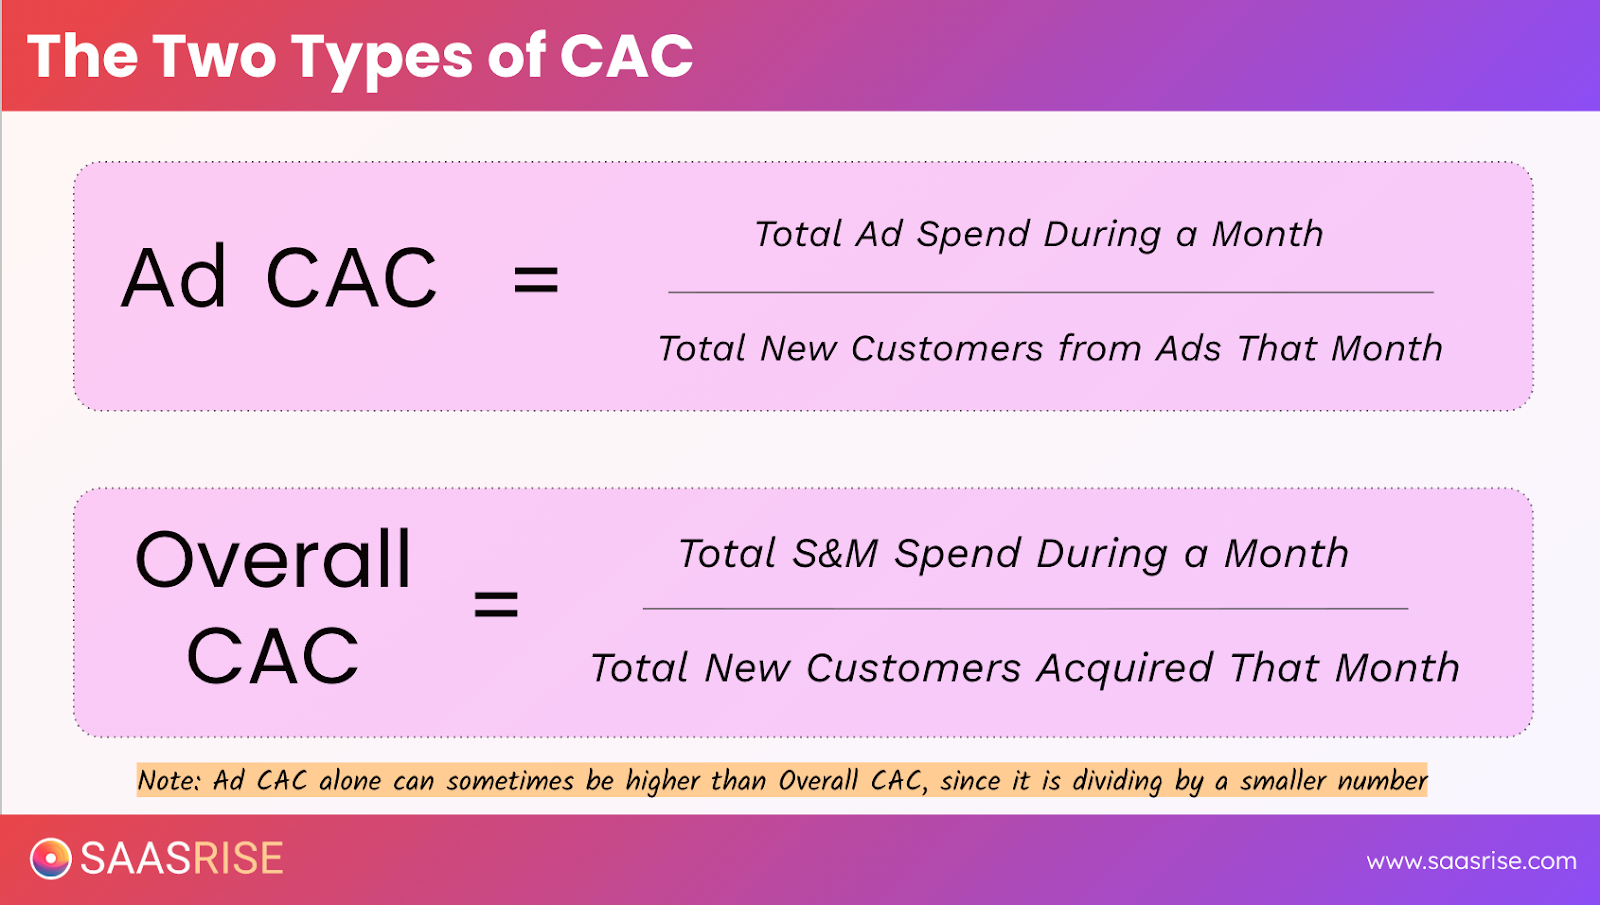
For most companies, overall CAC is more useful because it captures the halo effect of ads — paid exposure often drives organic signups that don’t get attributed properly.
2. Average Revenue Per Account (ARPA)
Use this formula:
ARPA = Total Monthly Revenue ÷ Total Paying Customers
For annual contracts, multiply ARPA by 12 to get ACV (Annual Contract Value). Include all recurring and usage-based revenue for a complete picture.
3. Monthly Churn
Monthly Churn = (Customers Lost ÷ Total Customers)
If you lost 5 out of 100 customers last month, churn is 5%.
4. Lifespan
Lifespan = 1 ÷ Monthly Churn
A 3% monthly churn rate means an average customer lifespan of 33 months.
5. Lifetime Value (LTV)**
LTV = ARPA × Lifespan
If ARPA is $500/month and lifespan is 30 months, LTV is $15,000.
Use lifetime revenue, not lifetime margin, unless you’re specifically modeling profitability after gross margin.
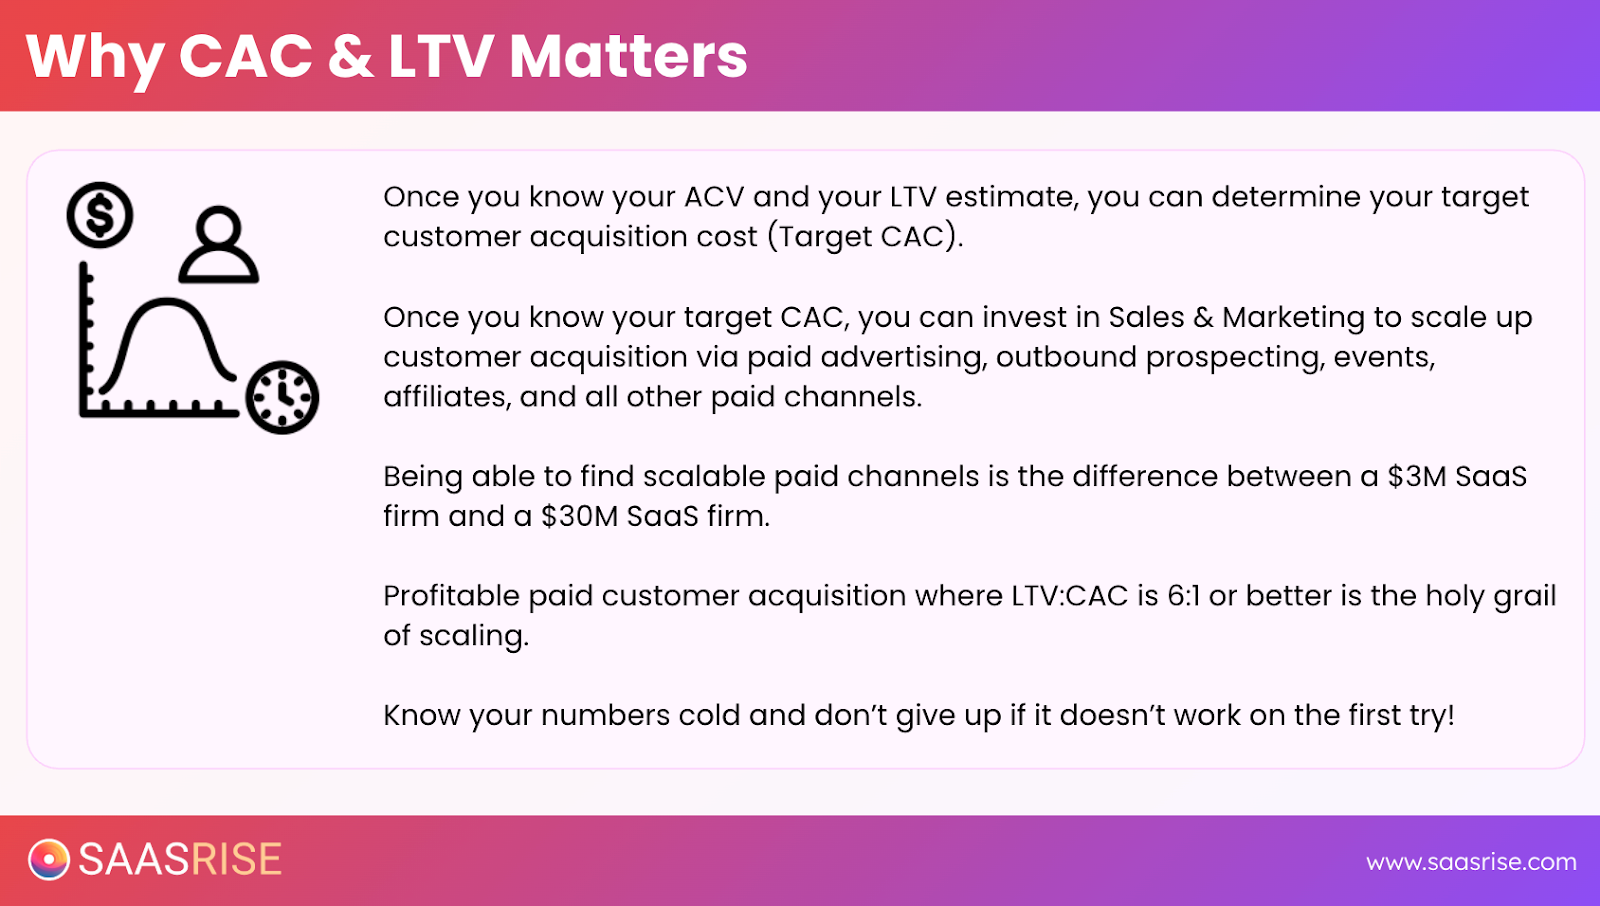
Determining Your Target CAC
Once you know your LTV, you can calculate your ideal or target CAC — the amount you can afford to spend to acquire a new customer.
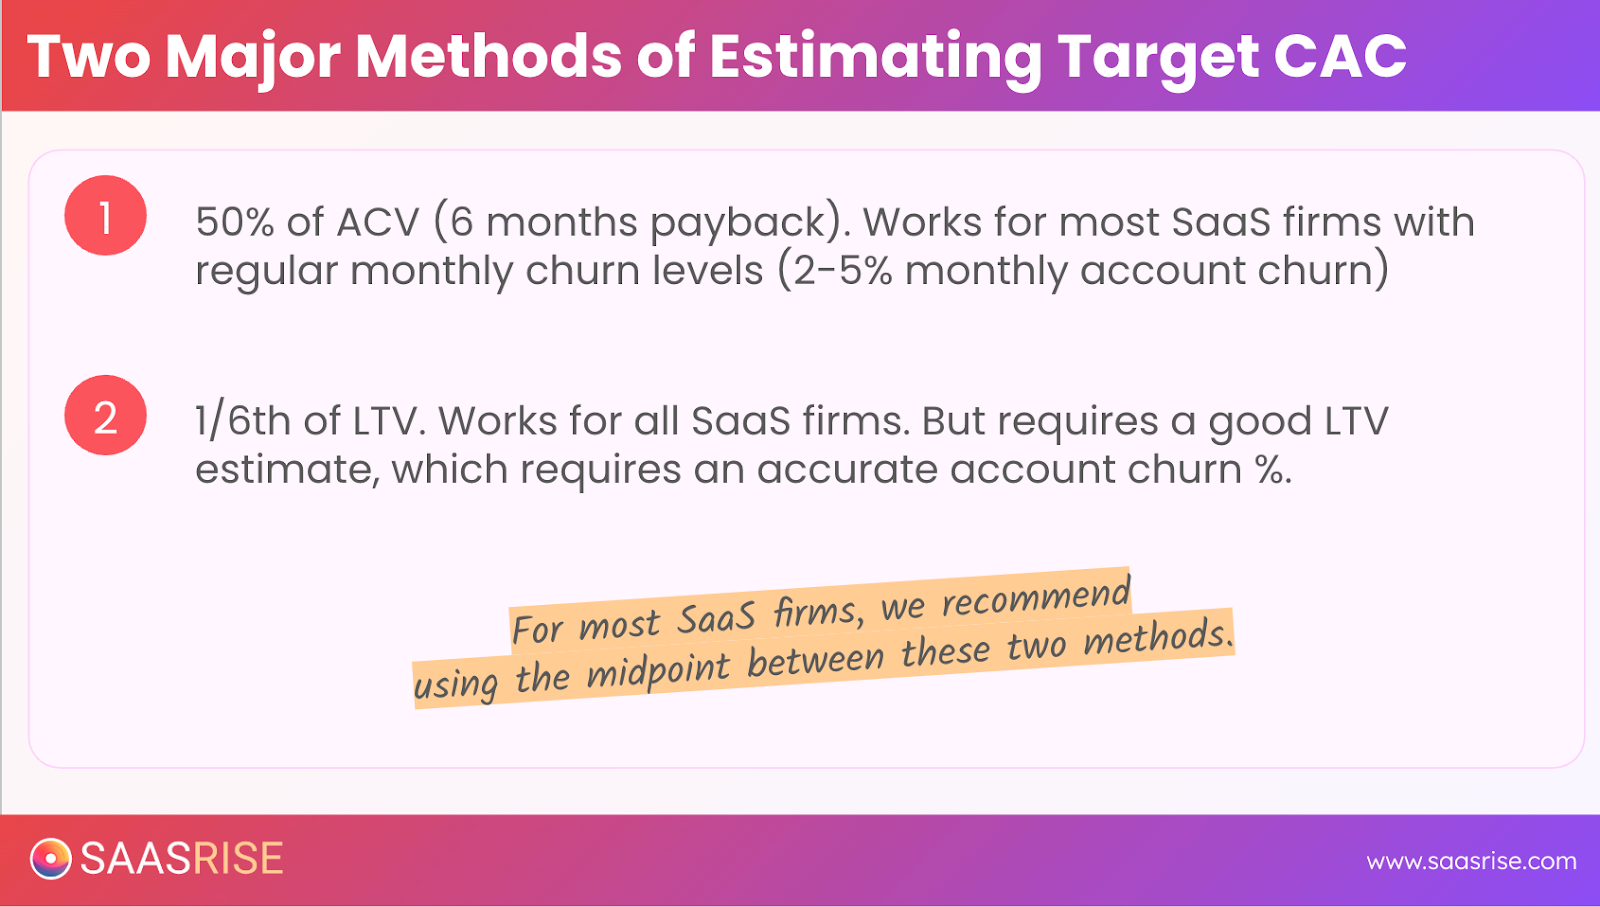
Two reliable methods:
Method 1: 50% of ACV
If your ACV is $10,000, your target CAC is $5,000.
This ensures a six-month payback period, assuming average churn.
Method 2: One-Sixth of LTV
If your LTV is $60,000, your target CAC is $10,000.
This gives you a 6:1 LTV:CAC ratio, a solid benchmark for bootstrapped or profitable growth.
Rule of Thumb
- Venture-backed SaaS: 4:1 LTV:CAC ratio, up to 12-month payback
- Bootstrapped SaaS: 6–8:1 LTV:CAC ratio, 6–9-month payback
The lower your churn and the longer your customer lifespan, the more you can afford to spend on acquisition.
Example Scenarios
Here’s how these formulas play out for different business models:
SMB SaaS
- ARPA: $50/month
- Churn: 5% (20-month lifespan)
- LTV: $1,000
- Target CAC: $166 (1/6 of LTV)
- Payback: 3–4 months
Mid-Market SaaS
- ARPA: $3,000/month
- Churn: 2% (50-month lifespan)
- LTV: $150,000
- Target CAC: $25,000
- Payback: 6 months
Enterprise SaaS
- ARPA: $10,000/month
- Churn: 1% (100-month lifespan)
- LTV: $1,000,000
- Target CAC: $125,000
- Payback: 12–15 months
The math scales cleanly. Higher-value, lower-churn accounts can justify much larger acquisition costs.
Why So Many SaaS Companies Stall at $5–10M ARR
Once a company hits early traction, the next growth ceiling often appears around $5M to $10M ARR.
That plateau usually happens because:
- Founders don’t know their numbers precisely.
- They underinvest in marketing out of fear.
- CAC appears “too high” only because LTV isn’t properly understood.
In reality, if your payback period is under nine months and your churn is under 4%, you should be spending more.
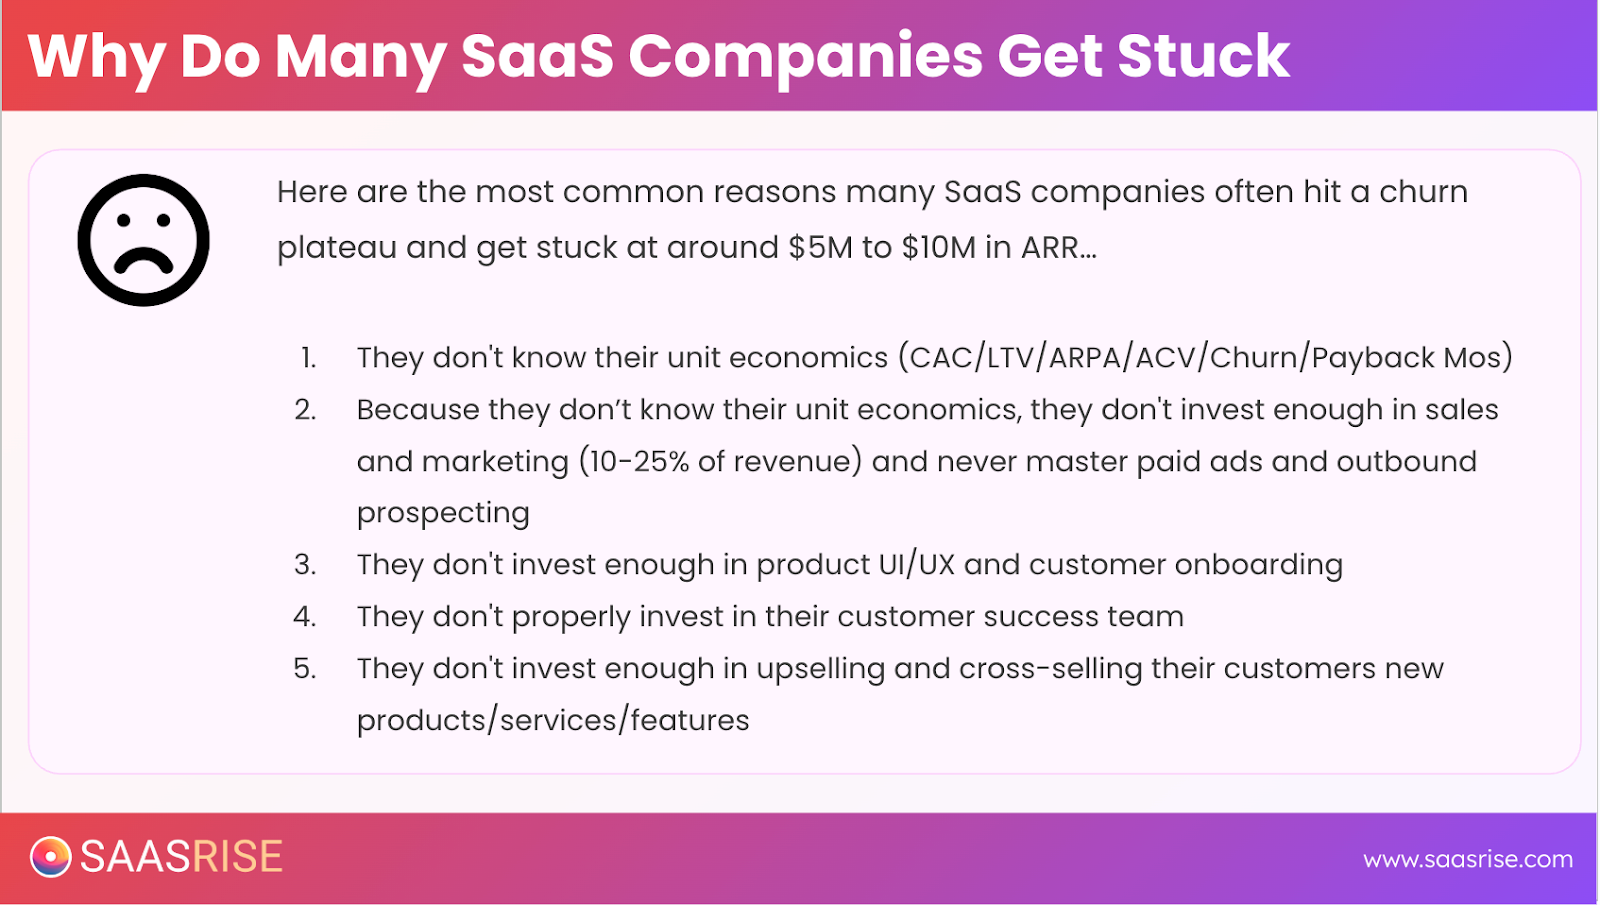
SaaS companies that grow from $3M to $30M ARR typically invest 10–25% of revenue in sales and marketing — and they do it confidently because they understand their economics.
Using Unit Economics to Build a Scalable Growth Model
Once you’ve nailed your math, you can design growth systems that scale profitably.
1. Set a Rational Marketing Budget
Base it on your LTV:CAC ratio and payback target. Bootstrapped firms often spend 10–20% of revenue; venture-backed firms can push 25–40%.
2. Choose Scalable Channels
Focus on acquisition channels that can deliver predictable CAC:
- Paid Ads (LinkedIn, Meta, Google)
- AI-Personalized Outbound
- Affiliate Partnerships
- SEO and Content Marketing
3. Measure With Attribution Tools
Use systems like Cometly, Dreamdata, or HockeyStack to connect marketing spend to pipeline and revenue. Measure both post-view and post-click conversions.
4. Iterate and Scale What Works
Run controlled experiments. Track CAC and payback per channel. Once a channel proves profitable, double your investment until returns start to flatten.
Benchmarks and Best Practices
Here’s a concise summary of the metrics every SaaS team should aim for:

Keep your NRR (Net Revenue Retention) above 100%. If you’re losing more customers than you’re acquiring, fix retention before you scale acquisition.
Using Data to Justify Marketing Investment
Once your payback math checks out, scaling marketing is logical, not risky.
Let’s do a simple ROI calculation:
If your company trades at the median SaaS multiple of 4.4× ARR, every $1 of recurring revenue you add increases enterprise value by $4.40.
Now imagine your marketing program produces a 6-month payback. That means every $1 invested in sales and marketing generates $2 in ARR and $8.80 in enterprise value.
At that point, scaling spend becomes a strategic imperative — you’re effectively printing enterprise value through customer acquisition.
Key Takeaways
- Know your numbers cold.
You should always know your ARPA, churn, LTV, CAC, and payback off the top of your head. - Aim for efficiency first.
A 6–8:1 LTV:CAC ratio gives you room to scale without risk. - Increase investment once your math works.
Under 9-month payback and low churn? Step on the gas. - Measure relentlessly.
Attribution, tracking, and iteration turn theory into predictable growth.
When you build a growth engine on data instead of intuition, you stop guessing and start scaling.
Final Word
SaaS growth doesn’t come from magic or luck — it comes from disciplined math.
Know what a customer is worth.
Know what you can afford to spend.
Invest with confidence when the numbers make sense.
That’s how you transform a $5M SaaS business into a $50M one — one data-driven decision at a time.
This content is from the 16 week B2B SaaS Growth Program that we run twice a year.