
The SaaS Churn Reduction Playbook 2026
This report provides a comprehensive, data-driven guide to understanding and reducing churn for SaaS companies operating at $1M to $100M+ in annual recurring revenue. Drawing on benchmarks from more than 2,500 B2B SaaS companies, case studies from operators who cut churn by 40–78%, and the latest research on AI-powered retention systems, we examine the full spectrum of churn reduction strategies available to SaaS CEOs in 2026. From the concept of Max MRR and its implications for your revenue ceiling, to the Aha Moment framework for onboarding, to AI early warning systems that predict at-risk customers 60–90 days in advance, this playbook equips founders with actionable strategies to turn retention into their most powerful growth lever. All churn figures in this report are expressed as annual percentages unless otherwise noted.
This report is published by SaasRise, the #1 mastermind community for SaaS CEOs with $1M–$100M+ in ARR. Members have collectively raised $1B+ and have $3B+ in ARR.
2026 SaaS Churn Benchmarks at a Glance
📋 Table of Contents
- Why Churn Is the #1 Lever for SaaS Growth
- Understanding Max MRR: Your Revenue Ceiling
- Logo Churn vs. Revenue Churn vs. NRR: Know Your Numbers
- Monthly vs. Annual Churn: The Conversion Table
- 2026 Annual Churn Benchmarks by ACV Segment
- Customer Lifetime Value: LTV = 1 ÷ Annual Account Churn
- When and Why Customers Churn: The Lifecycle View
- The Aha Moment: Engineering Activation to Reduce Early Churn
- Building an Early Warning System: Health Scores That Work
- AI-Powered Churn Prediction: Tools, Accuracy, and ROI
- Intervention Strategies: Saving At-Risk Customers
- Involuntary Churn: The 20–40% You’re Not Fixing
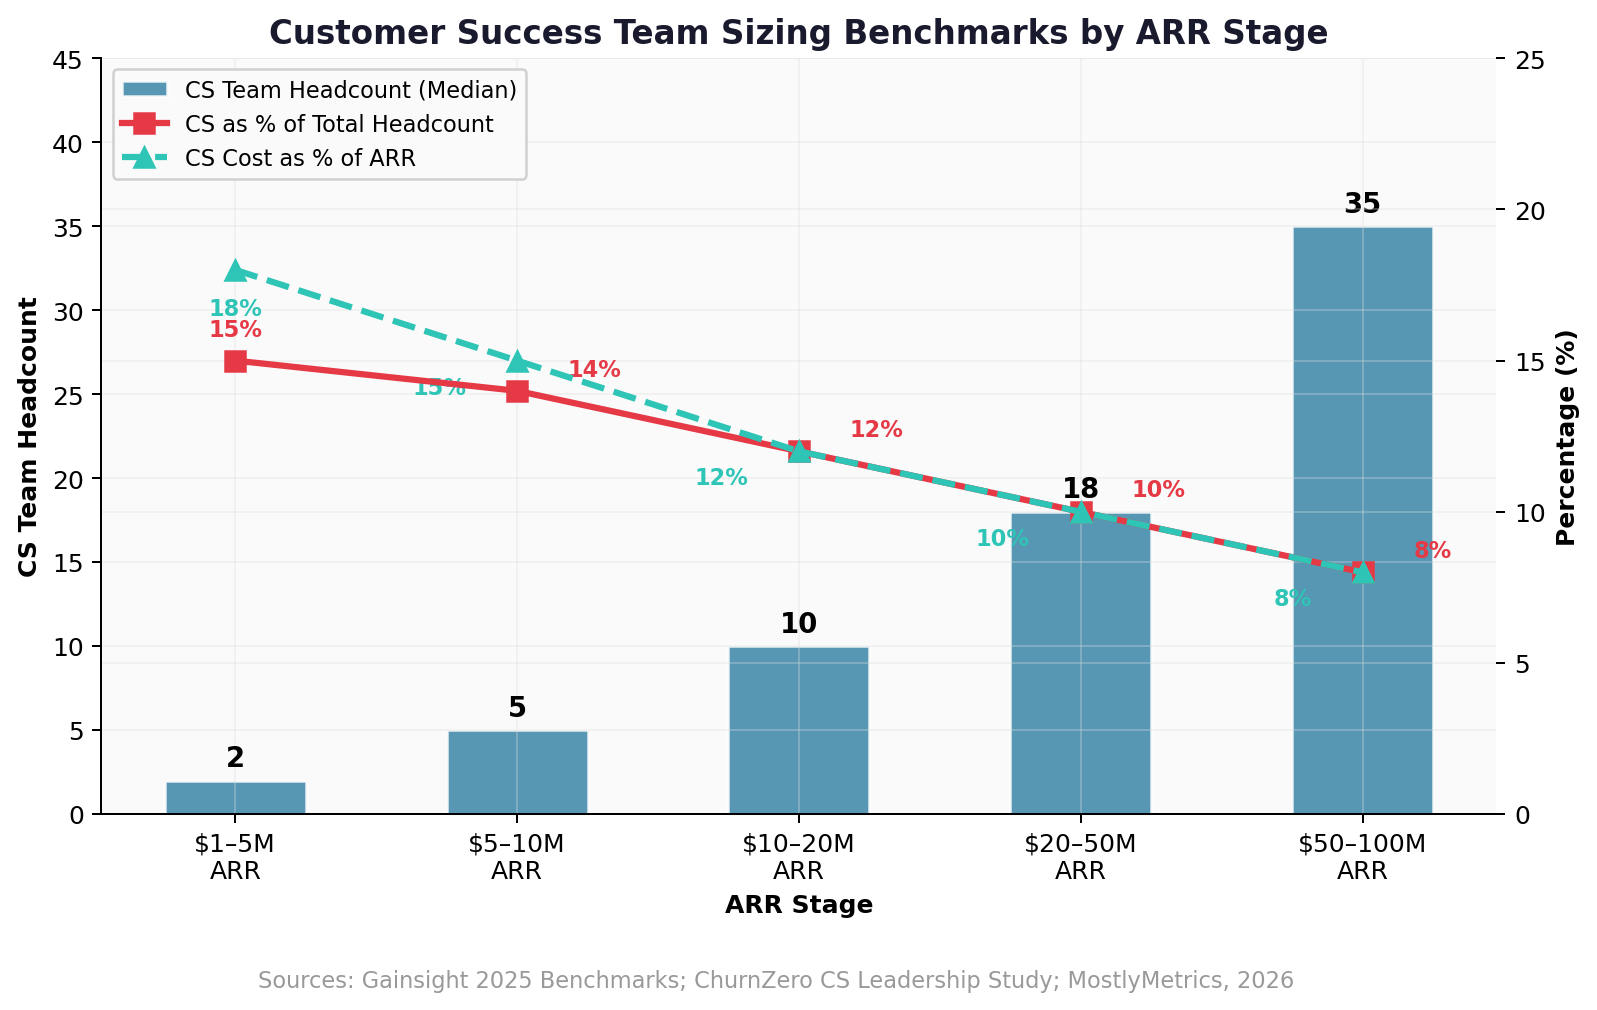
- Structuring Your CS Team for Retention at Scale
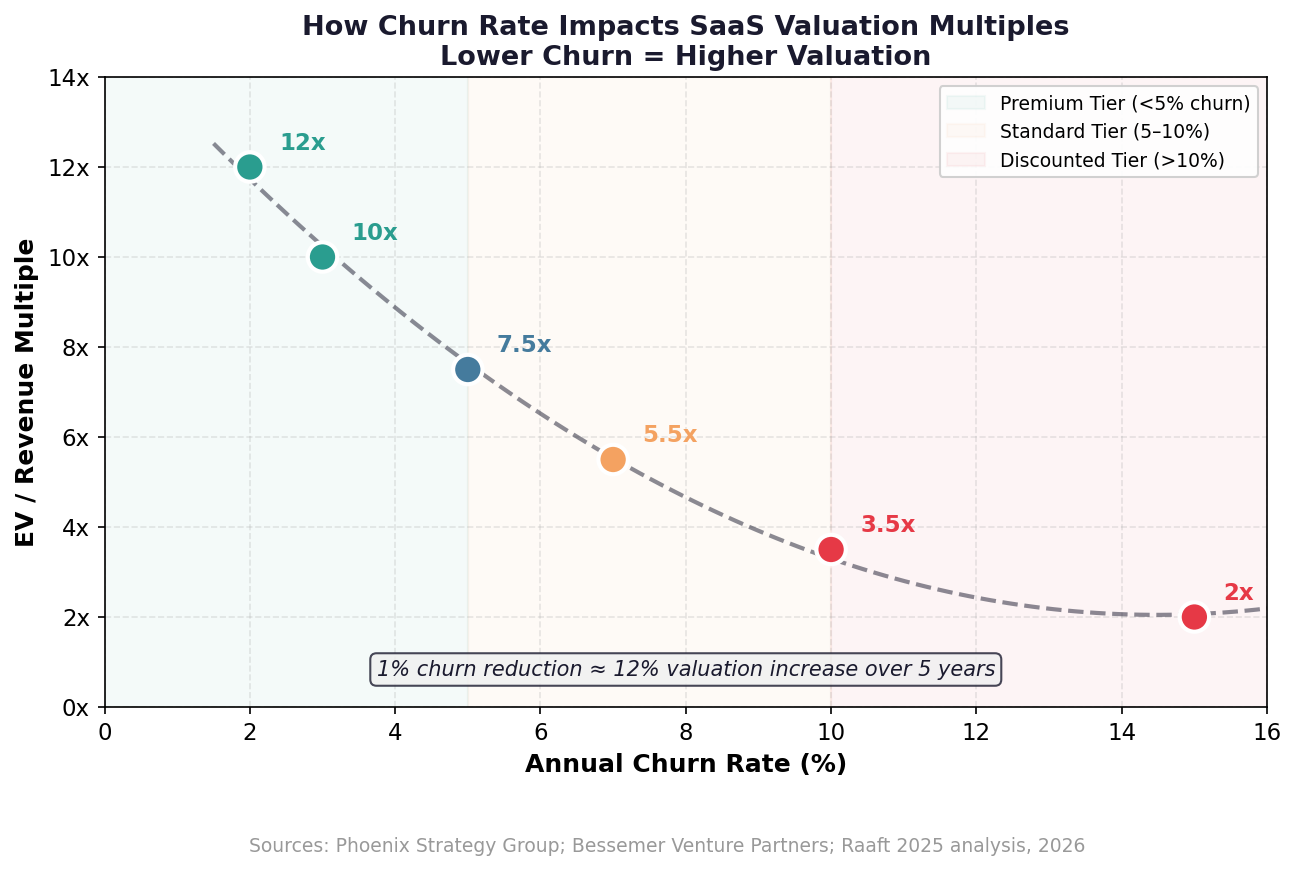
- Churn’s Impact on Valuation Multiples and Exit Readiness
- How Churn Levels Impact Max MRR: The Growth Ceiling in Practice
1. Why Churn Is the #1 Lever for SaaS Growth
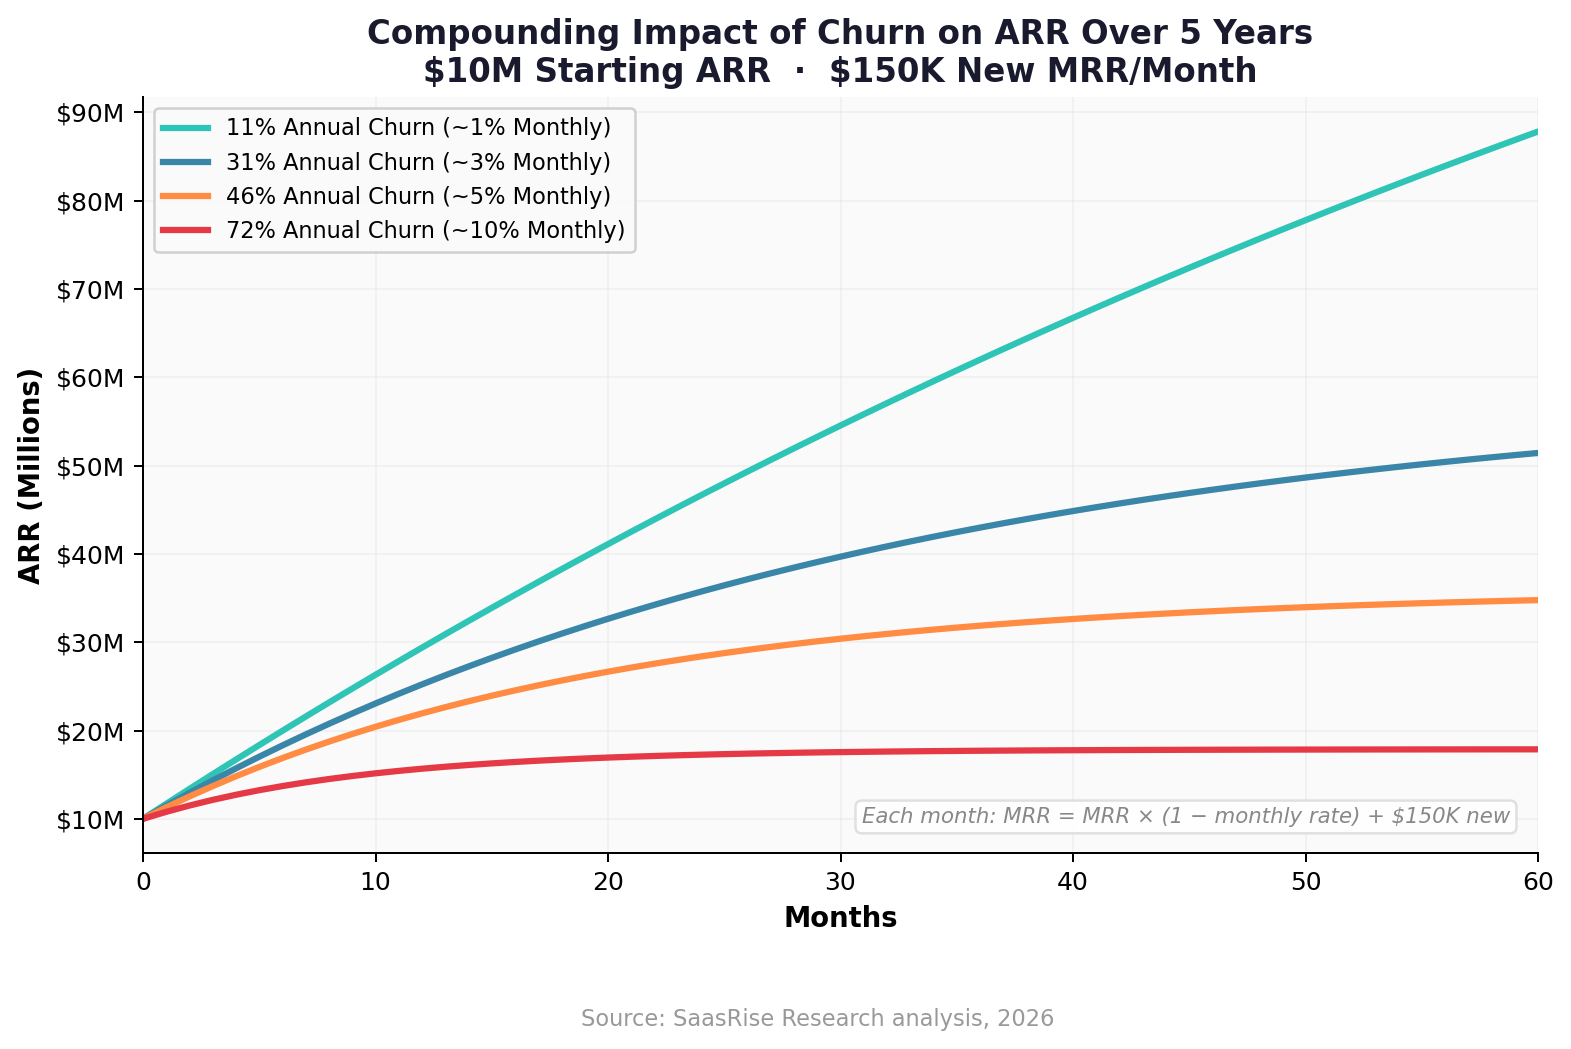
Every SaaS company celebrates new customer acquisitions, but the math of recurring revenue tells a different story: retention is the engine that determines whether a SaaS business scales to $100M or stalls at $20M. Consider two identical companies, each adding $150K in new MRR per month. The company with 31% annual account churn will grow to roughly $53M in ARR over five years. The company with 72% annual churn tops out at $18M—less than half—despite identical customer acquisition efforts.
The compounding nature of churn makes it uniquely destructive. As your revenue base grows, the absolute dollars lost to churn increase even if the percentage stays constant. At $5M ARR with 46% annual gross revenue churn, you lose $2.3M per year. At $20M ARR, you lose $9.2M per year. Eventually, the dollars churned each month equal the new revenue added, and growth stops entirely. This equilibrium point is your revenue ceiling—and every percentage point of annual churn reduction lifts that ceiling dramatically.
Research from Bain & Company has long established that a 5% increase in customer retention can boost profits by 25–95%. In the SaaS model, this effect is even more pronounced because of the recurring revenue structure. Every retained customer contributes not just this year’s revenue but all future years of revenue—and each dollar of expansion revenue from existing customers compounds on the retained base. McKinsey research confirms that reducing annual churn by 5 percentage points can increase a SaaS company’s enterprise value by 30–50% over five years.
The cost asymmetry is stark: Acquiring a new SaaS customer costs 5–25x more than retaining an existing one. Yet most SaaS companies at the $1M–$10M stage spend 3–5x more on sales and marketing than on customer success and retention. Rebalancing this equation is the single highest-ROI investment available to most SaaS CEOs.
2. Understanding Max MRR: Your Revenue Ceiling
Every SaaS company has an invisible revenue ceiling, and there is a simple formula to reveal it. Coined by Jason Cohen and popularized by Baremetrics and ChartMogul, the concept of Max MRR exposes the maximum monthly recurring revenue your business can achieve given its current growth and churn rates.
Max MRR = New MRR ÷ Monthly Churn Rate
As MRR grows, the absolute dollars lost to churn increase—even if the rate stays constant. Eventually, churn dollars equal new dollars, and growth stops. That equilibrium is your Max MRR.
Example: If you add $100K in new MRR each month and your annual account churn is 46% (equivalent to ~5% monthly), your business will top out at $2.0M MRR ($24M ARR). Cut annual churn to 26% (~2.5% monthly), and your ceiling doubles to $4.0M MRR ($48M ARR).
The power of this formula lies in its simplicity. It strips away the noise of month-to-month fluctuations and reveals the structural reality: your churn rate is the denominator of your growth equation. Halve your annual churn rate, and you approximately double your revenue ceiling. This is why retention is not just a customer success metric—it is the most powerful growth lever in SaaS.
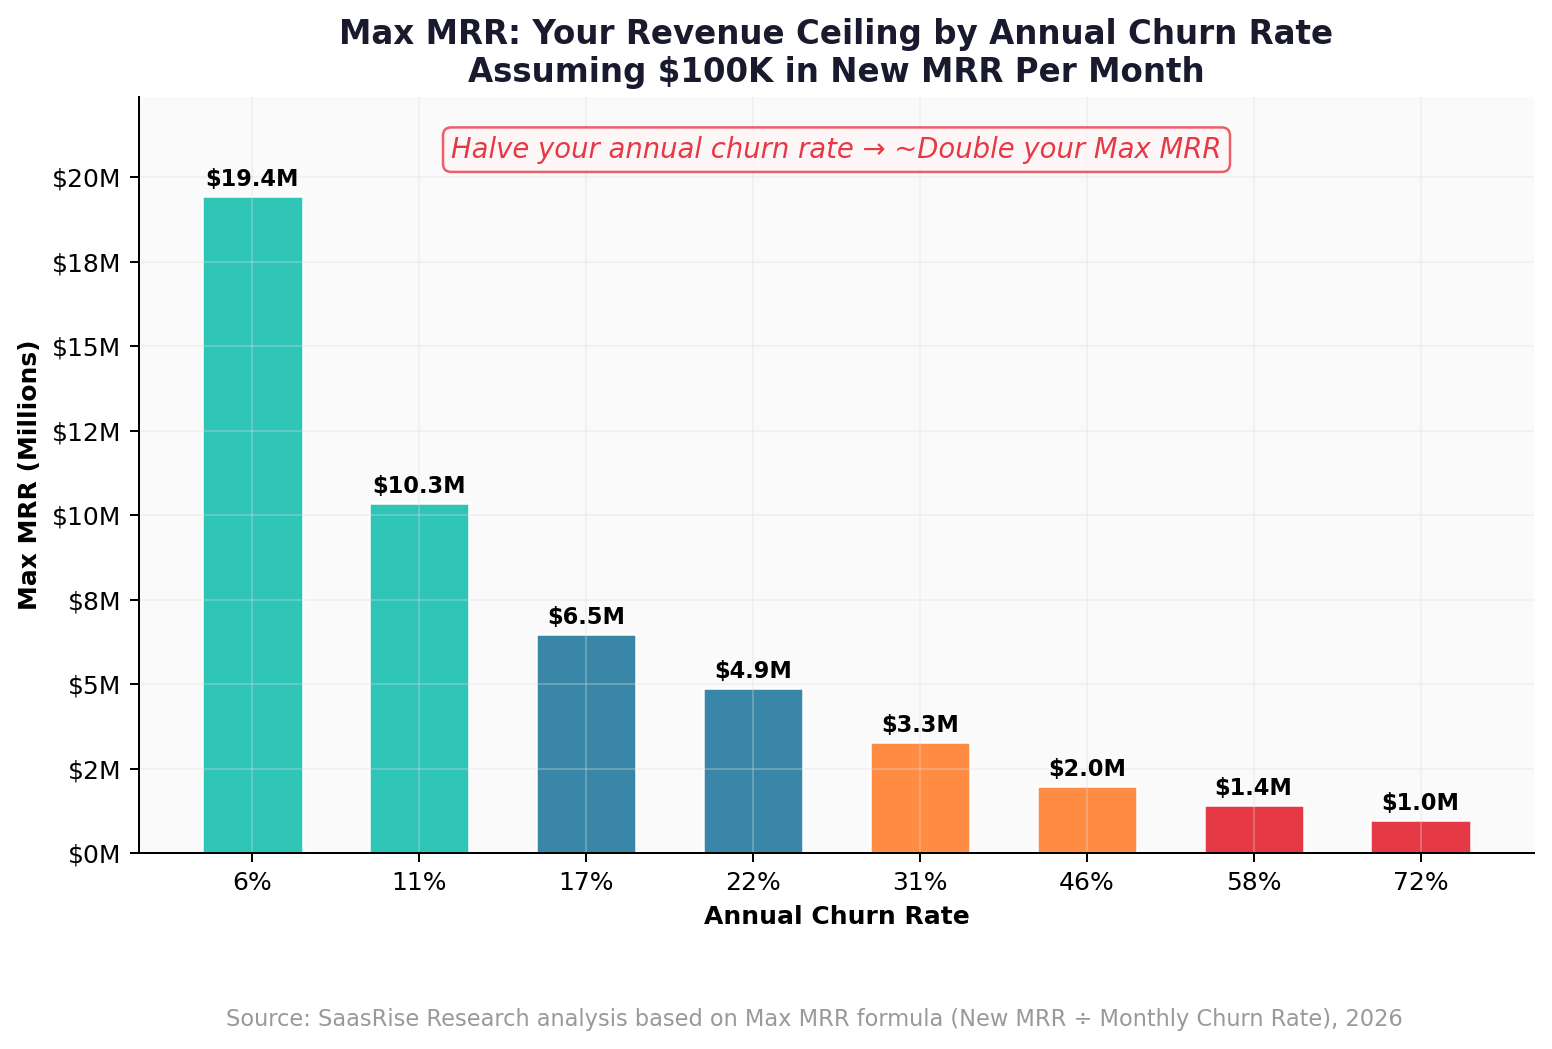
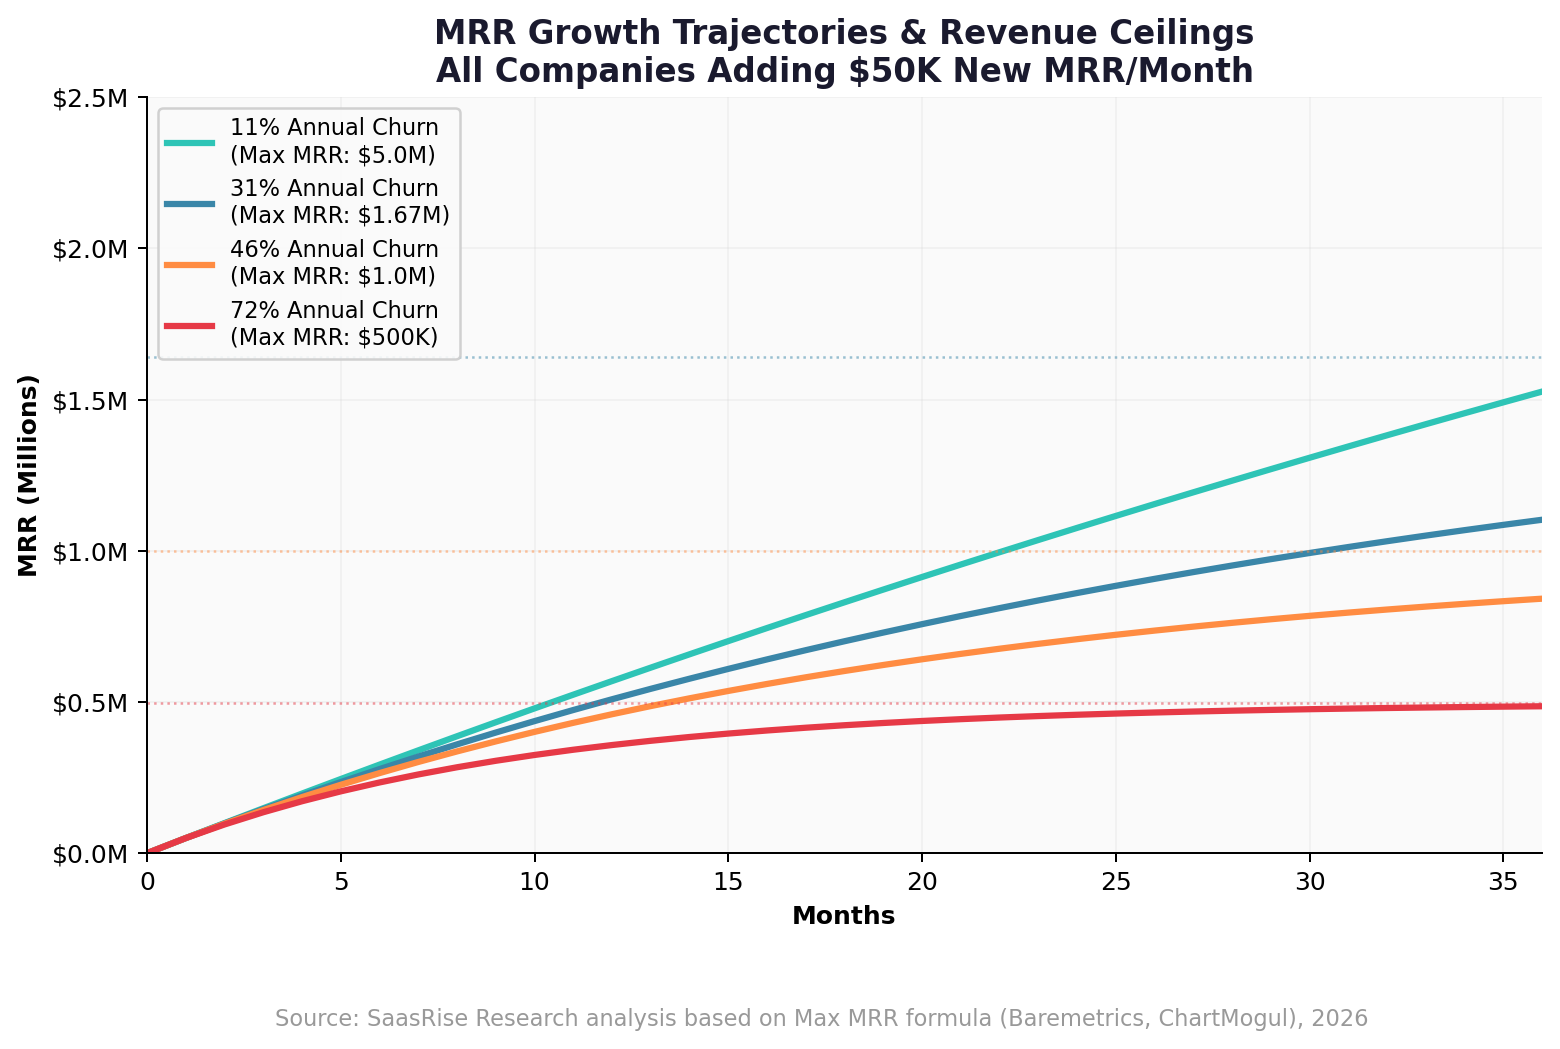
For SaaS CEOs at the $1M–$10M stage, this has immediate strategic implications. A company adding $50K in new MRR with 46% annual churn has a ceiling of $1.0M MRR ($12M ARR). Reducing annual churn to 31% raises the ceiling to $1.67M MRR ($20M ARR)—an additional $8M in terminal ARR from the same sales effort. At 11% annual churn, the ceiling jumps to $5.0M MRR ($60M ARR). The economics are unambiguous: reducing churn is the single most capital-efficient way to increase the value of a SaaS business.
When does Max MRR not apply? If your net revenue retention (NRR) exceeds 100%—meaning expansion revenue from existing customers exceeds churned revenue—you have no revenue ceiling. Your existing customer base grows on its own, even without new customers. This is the holy grail of SaaS economics, achieved by companies like Snowflake (NRR >130%), Datadog (NRR >120%), and Twilio (NRR >115%). For most B2B SaaS companies between $1M and $50M ARR, however, NRR is below 100%, making Max MRR a critical concept to understand.
Benchmark Your Churn Against 300+ SaaS CEOs
SaasRise members share real churn data, retention strategies, and playbooks in weekly CEO mastermind calls. See how your numbers compare.
Join SaasRise →3. Logo Churn vs. Revenue Churn vs. NRR: Know Your Numbers
One of the most common mistakes SaaS CEOs make is tracking only a single churn metric. In reality, churn is a family of metrics, and each tells a different story about the health of your business.
The Three Churn Metrics Every SaaS CEO Must Track
- Logo Churn (Customer Churn): The percentage of customers who cancel in a year. Tells you about product-market fit, but can mask revenue impact if small customers churn while large ones stay.
- Gross Revenue Retention (GRR): The percentage of recurring revenue retained after cancellations and downgrades, excluding expansion. This is the “true cost” of churn. Median B2B SaaS GRR is 88–90%; top quartile is 95%+.
- Net Revenue Retention (NRR): Revenue retained after accounting for churn, downgrades, AND expansion. NRR >100% means existing customers generate more revenue over time. Median private B2B SaaS NRR is 101%.
The distinction between logo churn and revenue churn is critical. A company may lose 35% of its logos annually but only 15% of revenue if the departing customers are small accounts. Conversely, losing just 5% of logos can represent 20% of revenue if your largest customers leave. This is why tracking both metrics—and understanding which customer segments drive each—is essential for targeted intervention.
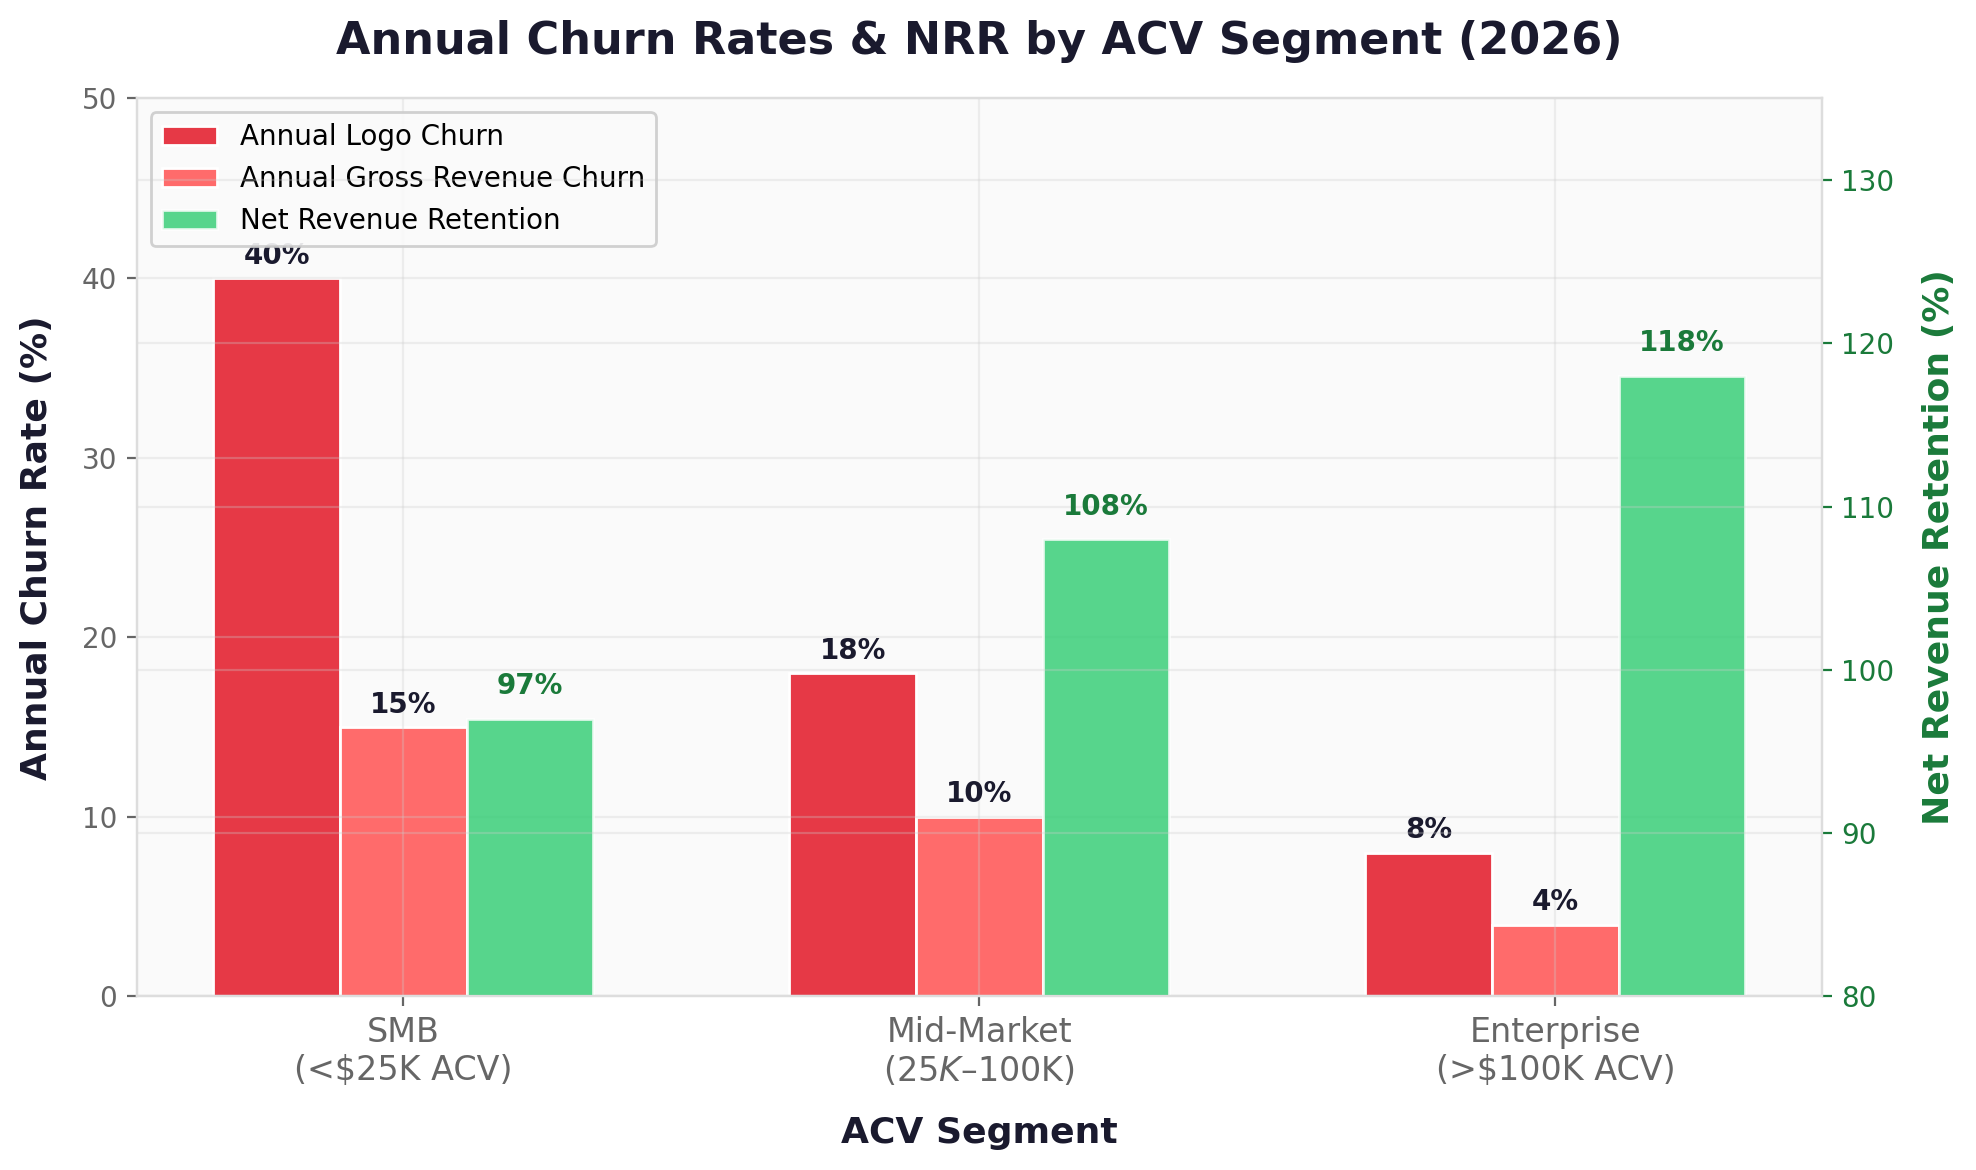
As companies move upmarket from SMB to Enterprise, a clear pattern emerges: both annual logo and revenue churn decline dramatically, while NRR increases. SMB customers churn at 35–50% per year, while Enterprise accounts churn at just 5–10%. This improvement reflects deeper integrations, multi-year contracts, higher switching costs, and pricing models that incorporate usage-based expansion.
| Metric | SMB (<$25K ACV) | Mid-Market ($25K–$100K) | Enterprise (>$100K ACV) |
|---|---|---|---|
| Annual Logo Churn | 25–50% | 12–22% | 5–10% |
| Annual Gross Revenue Churn | 12–18% | 8–12% | 3–6% |
| Gross Revenue Retention | 82–88% | 88–92% | 94–97% |
| Net Revenue Retention | 90–100% | 100–112% | 110–130% |
| Expected Customer Lifetime | 2–3 years | 5–7 years | 10–20 years |
4. Monthly vs. Annual Churn: The Conversion Table
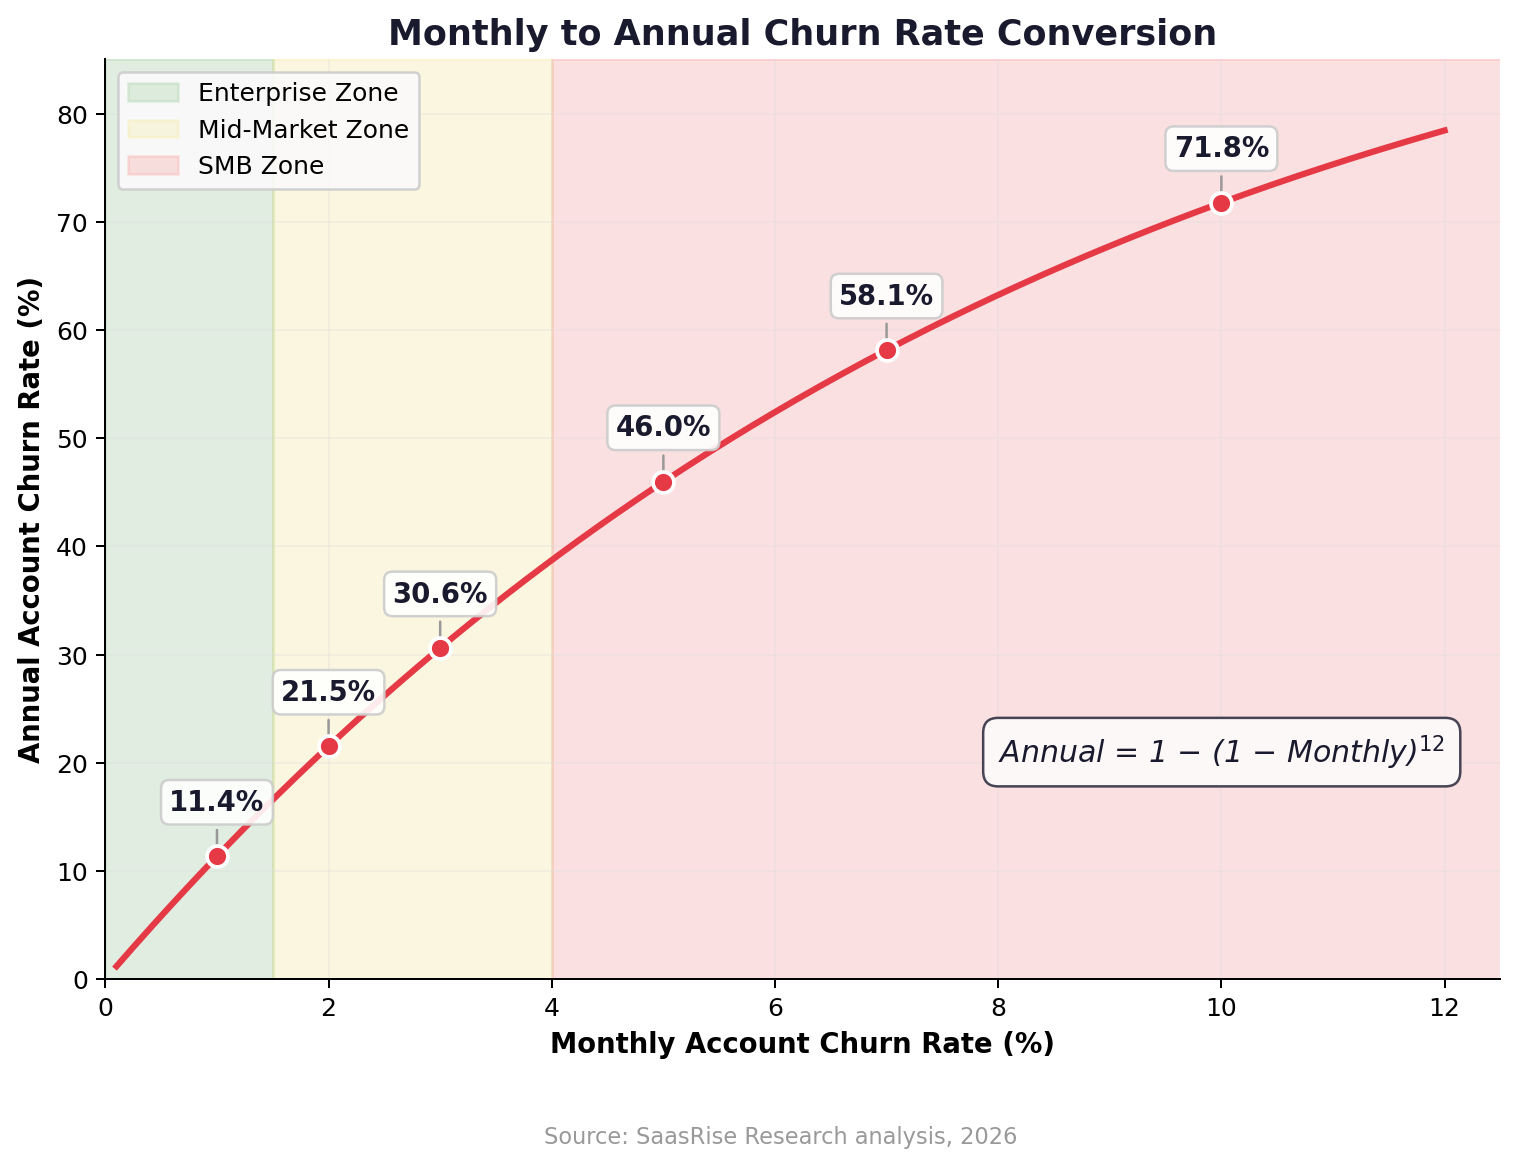
Many SaaS companies track churn on a monthly basis, but expressing churn as an annual figure makes its true impact dramatically clearer. A seemingly modest 3% monthly churn rate actually means you lose 31% of your customers every year. A 5% monthly rate means 46% annual churn—nearly half your customer base gone in 12 months. The relationship is not linear because of compounding: each month’s churn applies to the customers who survived the previous month.
The Conversion Formula
Annual Churn = 1 − (1 − Monthly Churn)12
This formula accounts for the compounding effect. A 5% monthly churn rate does not equal 60% annual churn (5% × 12). It equals 46%, because each month’s 5% applies only to the remaining customers, not the original base.
Monthly to Annual Churn Conversion Reference
| Monthly Churn | Annual Churn | Customers Retained After 1 Year | Typical ACV Segment |
|---|---|---|---|
| 0.5% | 5.8% | 94.2% | Enterprise (best-in-class) |
| 1.0% | 11.4% | 88.6% | Enterprise (median) |
| 1.5% | 16.6% | 83.4% | Mid-Market (strong) |
| 2.0% | 21.5% | 78.5% | Mid-Market (median) |
| 2.5% | 26.2% | 73.8% | Mid-Market (above avg) |
| 3.0% | 30.6% | 69.4% | SMB (strong) |
| 3.5% | 34.8% | 65.2% | SMB (median for <$1M ARR) |
| 4.0% | 38.7% | 61.3% | SMB (typical) |
| 5.0% | 46.0% | 54.0% | SMB / Self-Serve |
| 6.0% | 52.4% | 47.6% | Self-Serve / PLG |
| 7.0% | 58.1% | 41.9% | Self-Serve (high churn) |
| 8.0% | 63.2% | 36.8% | Consumer / Freemium |
| 10.0% | 71.8% | 28.2% | Consumer / Broken |
Why this matters for your board deck: If you report “3% monthly churn” to your board, it sounds manageable. But framing it as “we lose 31% of our customers every year” communicates the urgency far more effectively. Annual churn figures make the impact viscerally clear and create alignment around retention as a strategic priority. We recommend all SaaS companies express churn as an annual figure in board reporting and strategic planning.
5. 2026 Annual Churn Benchmarks by ACV Segment
Benchmarking your churn rate requires context. A 46% annual churn rate that is devastating for an enterprise SaaS company may be perfectly healthy for a self-serve SMB product. ACV, contract structure, and customer segment all influence what “good” looks like. Below, we break down 2026 benchmarks across the three primary ACV segments.
SMB Segment (<$25K ACV)
SMB SaaS companies face the highest churn rates in the industry. With smaller contract values, lower switching costs, and higher sensitivity to budget changes, SMB customers churn at 25–50% annually (logo churn), with annual gross revenue churn of 12–18%. Median NRR for SMB SaaS is just 97%—meaning the existing customer base shrinks slightly each year before new customer acquisition.
| SMB Metric (<$25K ACV) | Bottom Quartile | Median | Top Quartile |
|---|---|---|---|
| Annual Logo Churn | 50%+ | 35–40% | 20–25% |
| Annual Gross Revenue Churn | 18%+ | 12–15% | 8–10% |
| Gross Revenue Retention | <82% | 85–88% | 90–92% |
| Net Revenue Retention | 88% | 97% | 105% |
| Expected Customer Lifetime | <2 yrs | 2.5–3 yrs | 4–5 yrs |
Mid-Market Segment ($25K–$100K ACV)
Mid-Market SaaS occupies the sweet spot for many growing companies. Annual logo churn drops to 12–22%, annual gross revenue churn is 8–12%, and median NRR reaches 108%—meaning the existing base grows through expansion. This segment benefits from more thorough evaluation during purchase, higher switching costs, and structured onboarding.
| Mid-Market Metric ($25K–$100K ACV) | Bottom Quartile | Median | Top Quartile |
|---|---|---|---|
| Annual Logo Churn | 22%+ | 15–18% | 10–12% |
| Annual Gross Revenue Churn | 12%+ | 8–10% | 5–7% |
| Gross Revenue Retention | <88% | 90–92% | 93–95% |
| Net Revenue Retention | 98% | 108% | 115%+ |
| Expected Customer Lifetime | 4–5 yrs | 5.5–7 yrs | 8–10 yrs |
Enterprise Segment (>$100K ACV)
Enterprise SaaS achieves the lowest churn and highest retention. Annual logo churn of just 5–10%, annual gross revenue churn of 3–6%, and median NRR of 118% are the reward for long sales cycles, deep integrations, multi-year contracts, and dedicated customer success. Enterprise customers often become platform-dependent, making switching costs prohibitively high.
| Enterprise Metric (>$100K ACV) | Bottom Quartile | Median | Top Quartile |
|---|---|---|---|
| Annual Logo Churn | 10%+ | 6–8% | 3–5% |
| Annual Gross Revenue Churn | 6%+ | 4–5% | 2–3% |
| Gross Revenue Retention | <94% | 95–96% | 97–98% |
| Net Revenue Retention | 105% | 118% | 130%+ |
| Expected Customer Lifetime | 10 yrs | 13–17 yrs | 20+ yrs |
Contract structure matters enormously. Companies with 50%+ annual billing subscribers experience 40–60% lower gross churn rates compared to monthly-only billing. The annual commitment creates a natural retention effect: customers who pay upfront are more invested in getting value from the product. Offering a 15–20% discount for annual plans is one of the simplest and highest-impact churn reduction strategies available—and it works across all three ACV segments.
Learn Retention Strategies from Operators Who’ve Done It
SaasRise weekly calls feature SaaS CEOs sharing real churn reduction playbooks. No theory—just what actually worked at $1M–$100M+ ARR.
Apply to SaasRise →6. Customer Lifetime Value: LTV = 1 ÷ Annual Account Churn
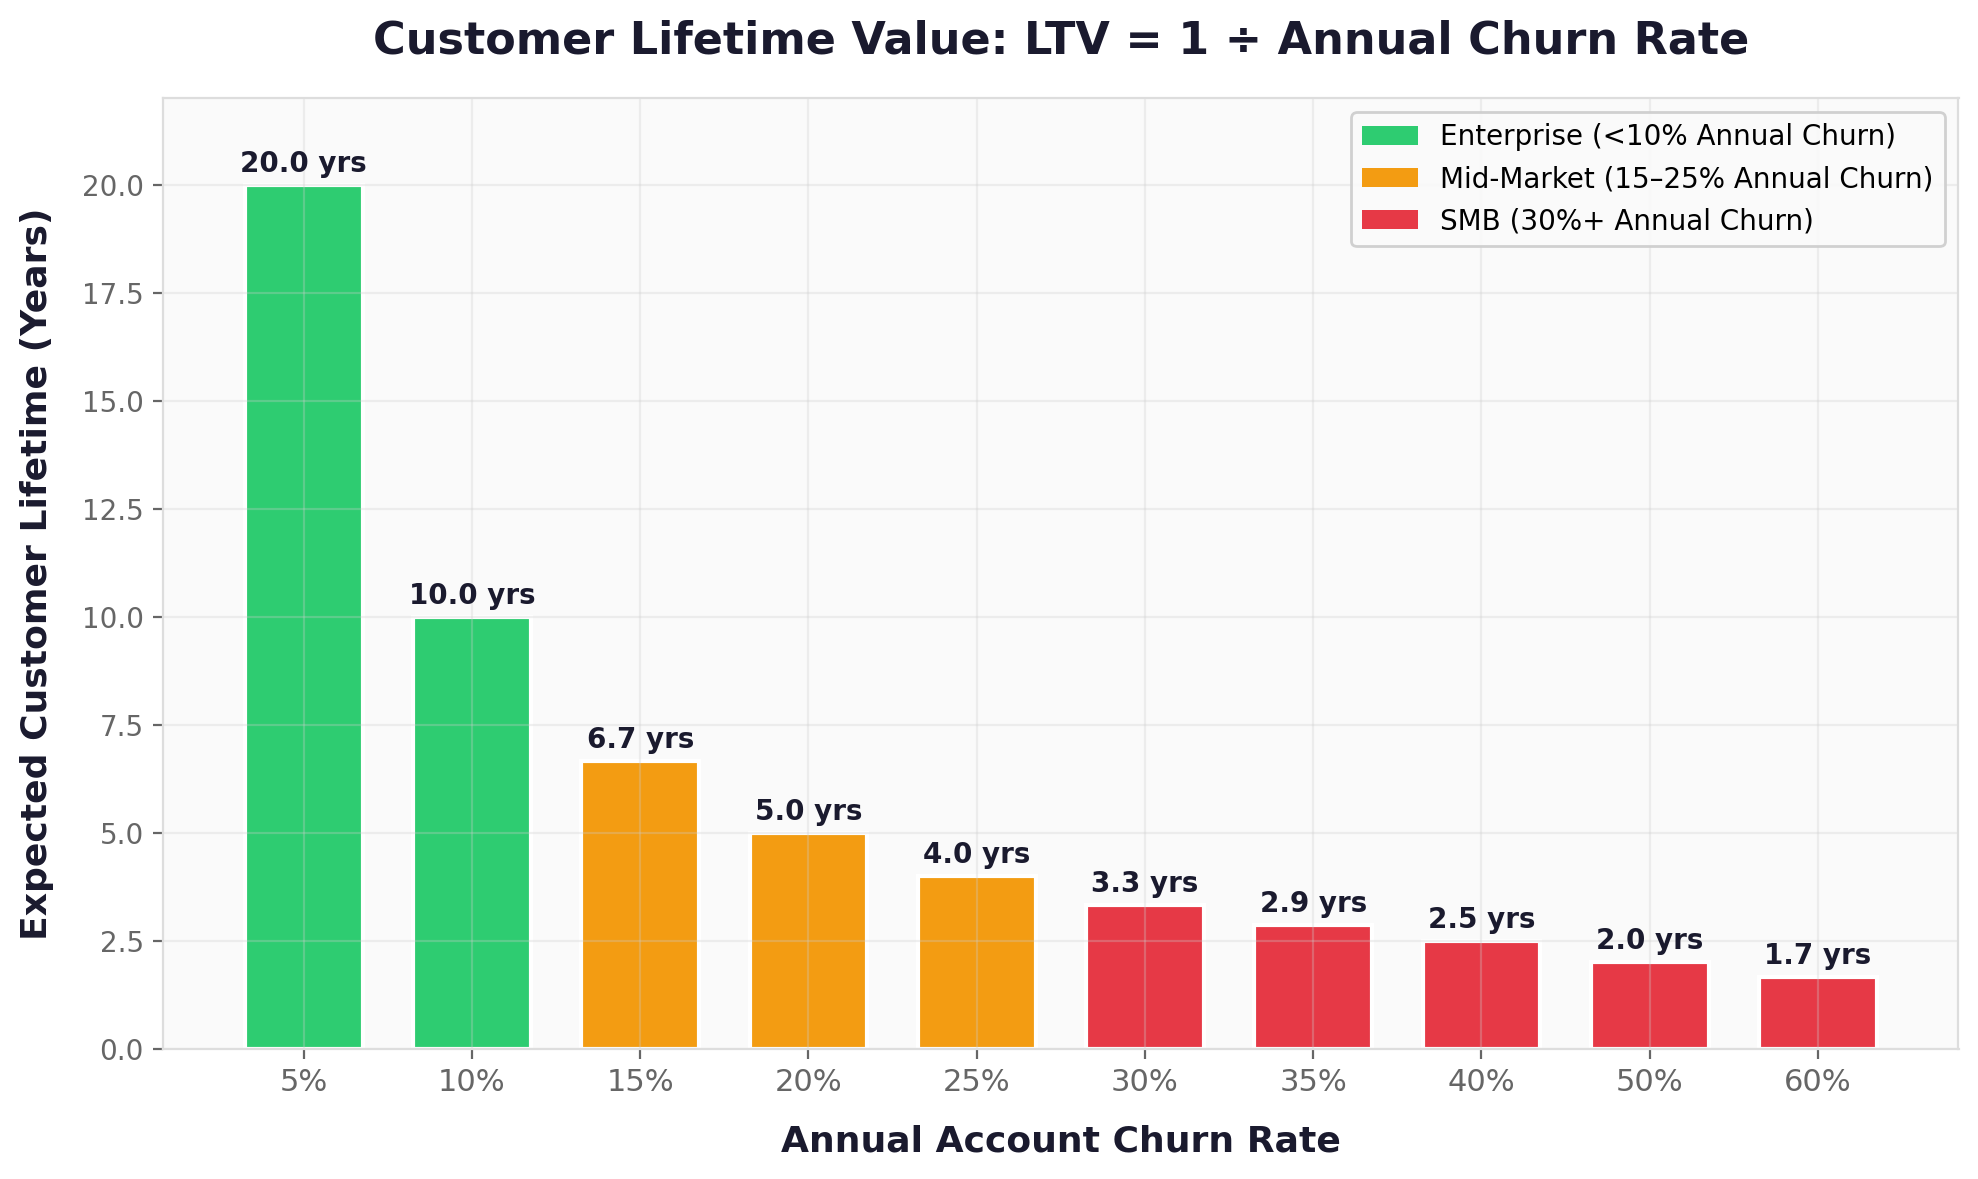
One of the most powerful—and elegantly simple—relationships in SaaS economics is the formula for expected customer lifetime. If your annual account churn rate is fixed at some percentage, the expected number of years a customer stays is simply the inverse of that rate.
Customer Lifetime (Years) = 1 ÷ Annual Account Churn Rate
If your annual account churn is 20%, the average customer stays for 1 ÷ 0.20 = 5 years.
If your annual account churn is 10%, the average customer stays for 1 ÷ 0.10 = 10 years.
If your annual account churn is 5%, the average customer stays for 1 ÷ 0.05 = 20 years.
This formula comes from the geometric distribution: if each year has a fixed probability of churn, the expected number of years until churn is the reciprocal of that probability.
Once you know the expected customer lifetime, calculating Customer Lifetime Value (LTV) is straightforward:
LTV = ACV × Customer Lifetime = ACV ÷ Annual Account Churn Rate
Enterprise example: $120K ACV with 8% annual churn → Lifetime = 12.5 years → LTV = $1.5M
Mid-Market example: $50K ACV with 18% annual churn → Lifetime = 5.6 years → LTV = $278K
SMB example: $12K ACV with 40% annual churn → Lifetime = 2.5 years → LTV = $30K
LTV by ACV Segment
| ACV Segment | Typical ACV | Median Annual Churn | Expected Lifetime | Estimated LTV | Typical LTV/CAC |
|---|---|---|---|---|---|
| Enterprise (>$100K) | $120K–$250K | 6–8% | 12.5–17 years | $1.5M–$4.2M | 5–10x |
| Mid-Market ($25K–$100K) | $40K–$75K | 15–18% | 5.6–6.7 years | $220K–$500K | 3–6x |
| SMB (<$25K) | $8K–$20K | 35–40% | 2.5–2.9 years | $20K–$58K | 2–4x |
This is why churn reduction is so powerful for unit economics. Consider a Mid-Market SaaS company with $50K ACV. Reducing annual churn from 25% to 15% increases customer lifetime from 4 years to 6.7 years and LTV from $200K to $333K—a 67% increase in the value of every customer acquired, with zero additional acquisition cost. If that company’s CAC is $60K, the LTV/CAC ratio jumps from 3.3x to 5.6x, transforming marginal unit economics into highly efficient ones.
The LTV/CAC Framework: What Investors Look For
- LTV/CAC < 1.0x: The business is destroying value. Every customer acquired loses money over their lifetime. Urgent problem.
- LTV/CAC 1.0–3.0x: Viable but fragile. Business can survive but cannot afford aggressive growth spending.
- LTV/CAC 3.0–5.0x: Healthy SaaS economics. This is the minimum bar most VCs look for. The business can profitably reinvest in growth.
- LTV/CAC > 5.0x: Excellent. The business either has best-in-class retention (low churn) or highly efficient acquisition. Often a signal of strong product-market fit.
Important nuance: The simple LTV = 1/Churn formula assumes a constant churn rate across the customer’s lifetime. In practice, churn is front-loaded: customers who survive the first year churn at much lower rates in subsequent years. This means the simple formula slightly underestimates the true LTV of customers who get through the initial “danger zone.” More sophisticated models use cohort-based survival analysis, but the 1/Churn formula remains the standard quick-calculation method used across the SaaS industry.
7. When and Why Customers Churn: The Lifecycle View
Churn is not evenly distributed across a customer’s lifecycle. Research across thousands of B2B SaaS companies consistently shows that 70% or more of churn decisions are made within the first 90 days of a customer relationship. Understanding when customers are most at risk—and why—is essential for targeting interventions where they will have the greatest impact.
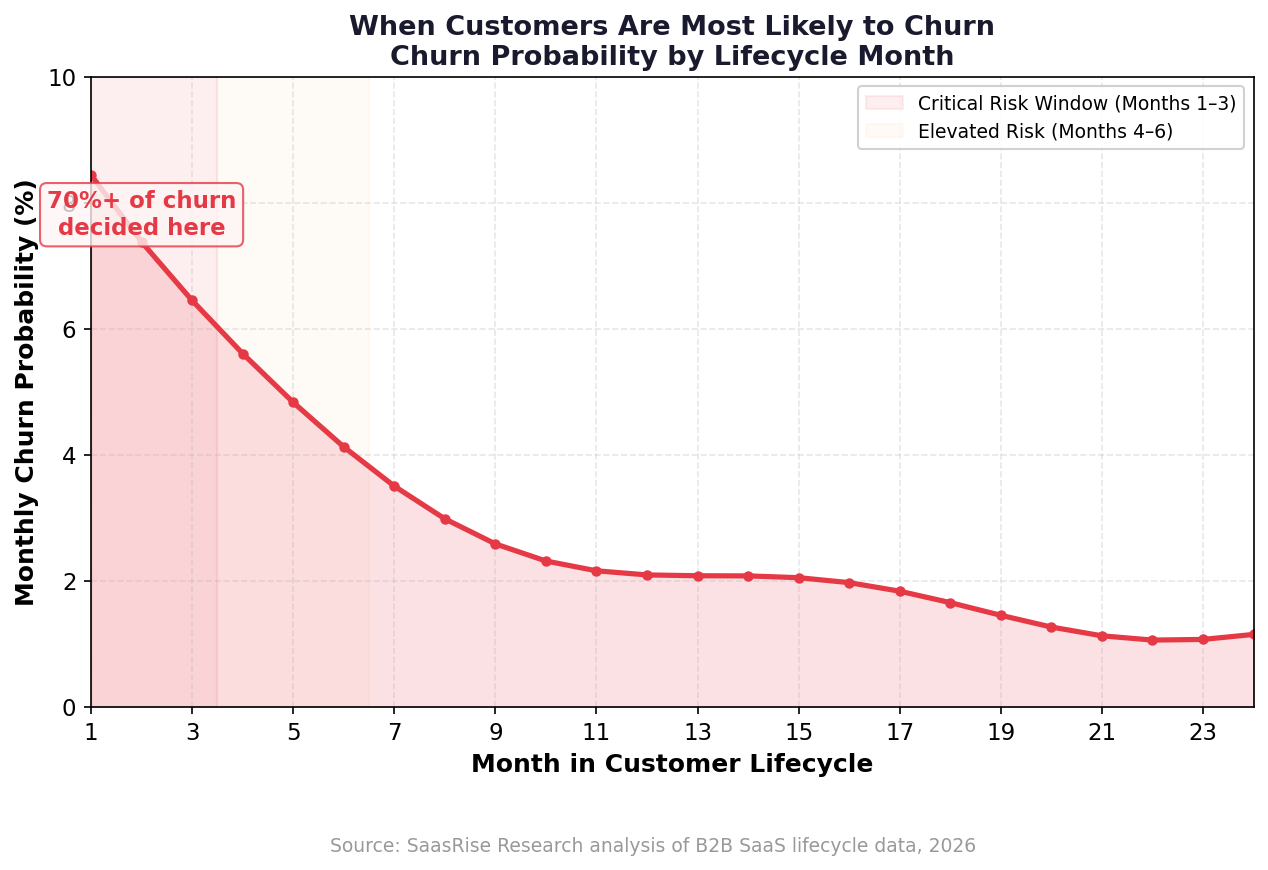
The first 30 days are where the battle is won or lost. Customers who don’t experience value within the first week have a 60% higher churn probability than those who reach their “aha moment” quickly. The pattern holds across all ACV segments, though the absolute churn rates differ dramatically:
| Churn Timing | SMB (<$25K) | Mid-Market ($25K–$100K) | Enterprise (>$100K) |
|---|---|---|---|
| First 90 days (% of total annual churn) | 55–65% | 45–55% | 30–40% |
| Months 4–12 | 25–30% | 25–30% | 25–30% |
| After year 1 (annual) | 10–20% | 15–25% | 30–40% |
Top Reasons SaaS Customers Churn
| Churn Reason | % of Total Churn | When It Typically Occurs | Preventability |
|---|---|---|---|
| Unmet expectations / poor fit | 27% | First 90 days | Medium (improve sales qualification) |
| Failed to achieve value | 22% | First 6 months | High (improve onboarding) |
| Involuntary / payment failure | 20–34% | Any renewal | Very High (dunning automation) |
| Insufficient resources | 17% | Months 3–12 | Medium (product simplification) |
| Poor customer service | 14% | Any time | High (CS team investment) |
| Competitive switch | 2–5% | At renewal | Low (requires product moat) |
Get Ready for Your SaaS Exit
Low churn is the #1 factor acquirers and investors look for. SaasRise members work with M&A advisors and PE firms to prepare for premium exits.
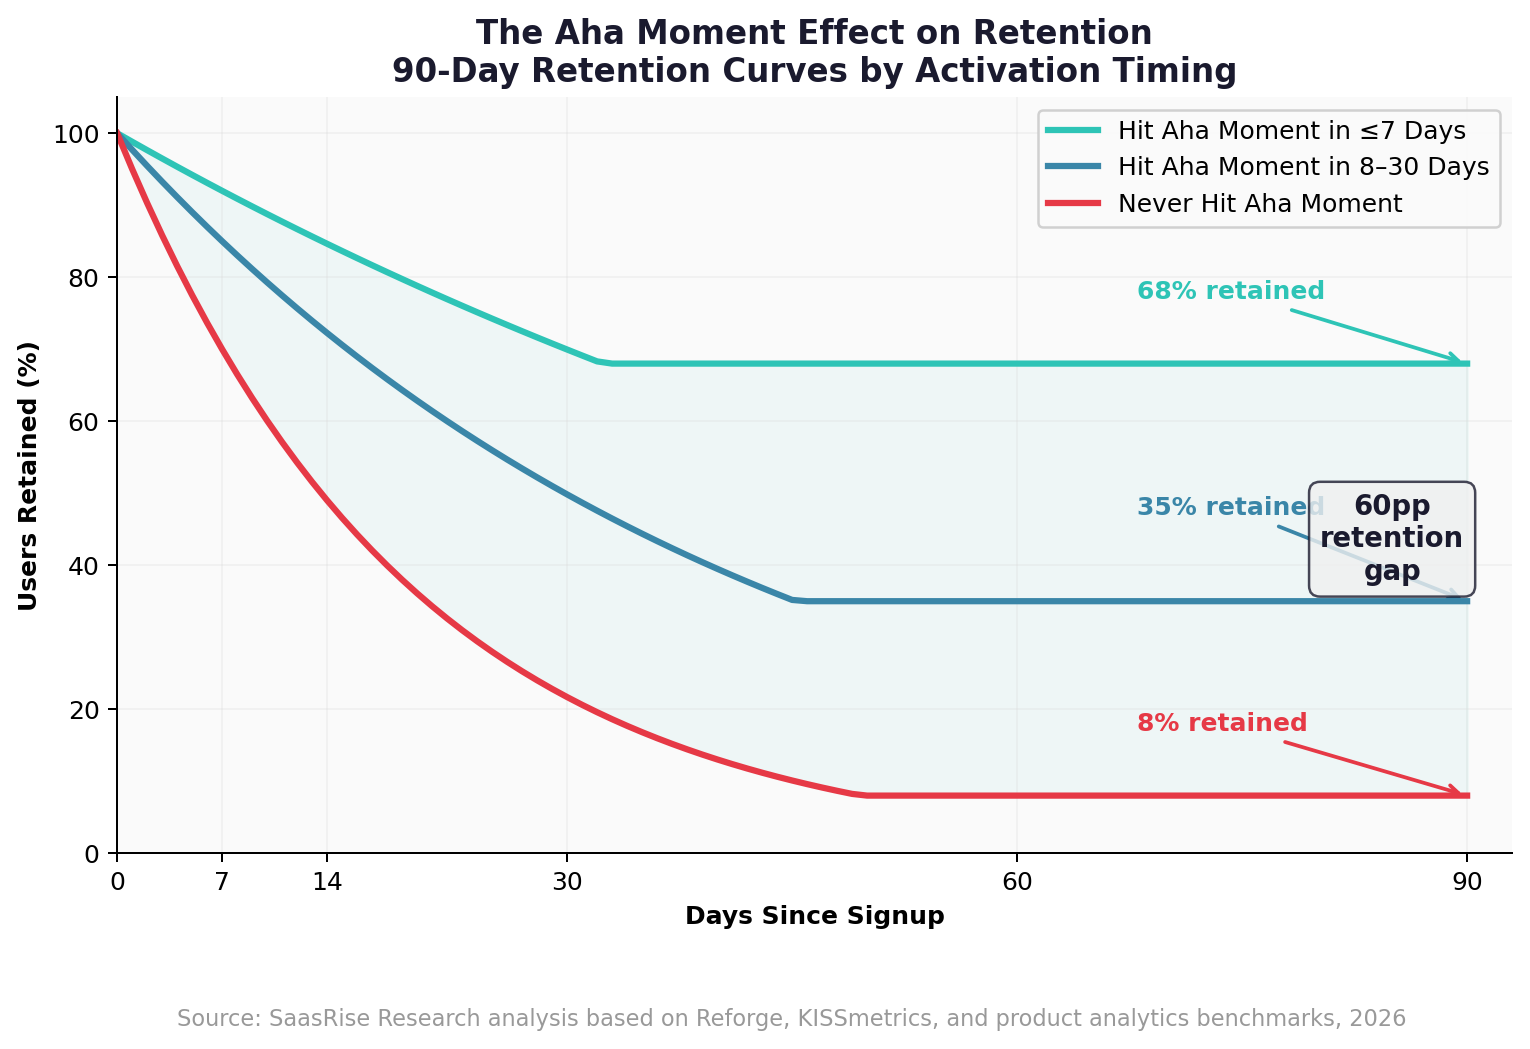
Learn About SaasRise →8. The Aha Moment: Engineering Activation to Reduce Early Churn
Every SaaS product has a moment where users suddenly “get it”—the cognitive shift where perceived value exceeds the cost of continued engagement. This is the Aha Moment, and it is the single most important concept in early churn prevention. Users who reach their Aha Moment within the first 7 days show dramatically higher 90-day retention than those who never do—a gap of up to 60 percentage points.
How to Find Your Aha Moment
The process is rigorous but straightforward. First, define “retained” for your product—typically, the user is active at day 30. Second, separate your user base into retained and churned cohorts. Third, catalog every action each group took in their first 7 days and compare the two groups. Look for actions where the completion rate diverges dramatically between retained and churned users—typically a 20+ percentage point gap.
Aha Moment Examples from Real SaaS Companies
- Slack: Teams that sent 2,000+ messages retained at dramatically higher rates
- Dropbox: Users who saved one file to a folder became long-term customers
- HubSpot: Users who set up one marketing automation workflow within 7 days
- Groove: Users with initial sessions >3 minutes 18 seconds had dramatically lower churn
Activation Rate Benchmarks
| Activation Rate | Assessment | Implications |
|---|---|---|
| Below 20% | Product or onboarding is broken | Major friction; prioritize above all else |
| 20–30% | Shippable but significant room to improve | Focus on reducing time-to-aha |
| 30–40% | Healthy for most B2B SaaS | Iterate on onboarding experiments |
| 40–60% | Strong / excellent | Optimize, but acquisition may be higher ROI |
| 60%+ | Exceptional (or aha definition too easy) | Validate that aha correlates with retention |
Time-to-value (TTV) is the control knob for activation rate. Products that achieve Aha Moment delivery within 5 minutes show 40% higher 30-day retention compared to those requiring 15+ minutes. The five changes that deliver 80% of activation gains are: a shorter signup form, time-to-aha under 10 minutes, pre-populated demo data, a visible next step on every screen, and a scheduled email that fires if activation stalls.
9. Building an Early Warning System: Health Scores That Work
A customer health score is a composite metric that predicts the likelihood of a customer renewing or churning. When implemented correctly, health scores transform customer success from reactive firefighting into proactive relationship management. The data shows a clear correlation between health score and annual churn probability.
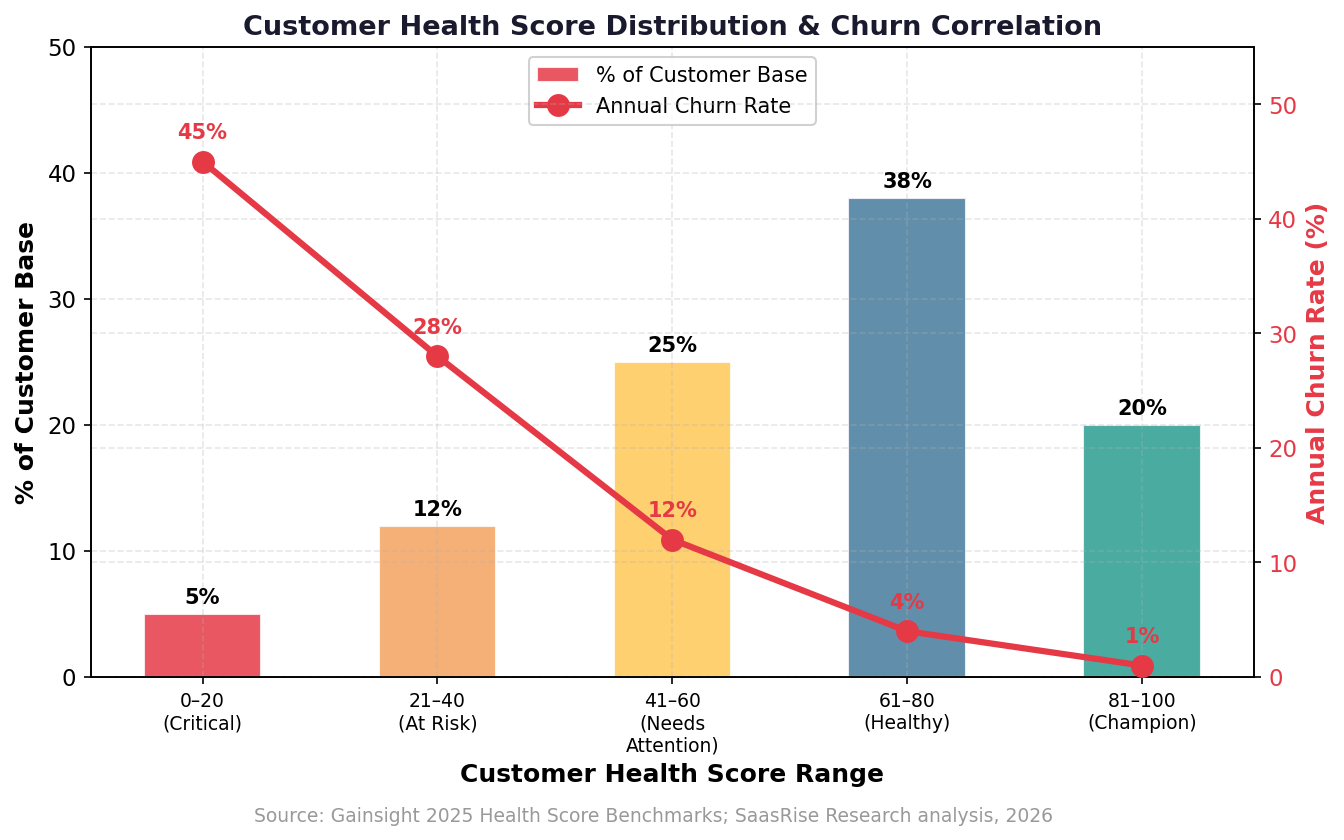
Customers with health scores in the “Critical” range (0–20) churn at 45% annually, compared to just 1% for “Champion” accounts (81–100). The key insight is that the 17% of your customer base sitting in the Critical and At Risk tiers likely represents 60–70% of your total churn. Targeted intervention on this segment offers the highest ROI of any retention investment.
Building an Effective Health Score
| Signal Category | Example Metrics | Typical Weight |
|---|---|---|
| Product Usage | Login frequency, feature adoption, session duration | 35–45% |
| Engagement | Support ticket sentiment, NPS/CSAT, meeting attendance | 20–30% |
| Outcome Achievement | ROI realized, goals met, KPIs improved | 15–25% |
| Relationship | Executive sponsor engagement, champion changes, stakeholder breadth | 10–20% |
The critical mistake: Most companies build health scores based on assumptions rather than data. Don’t assume that login frequency predicts retention—validate it. Run a regression analysis on your historical churn data to identify which signals actually predict churn in your product, and weight your health score accordingly.
10. AI-Powered Churn Prediction: Tools, Accuracy, and ROI
Traditional churn analysis relies on obvious signals like payment failures or support tickets. AI-powered systems detect subtle behavioral changes weeks or months before customers actually leave, enabling intervention at optimal moments rather than when it is already too late.
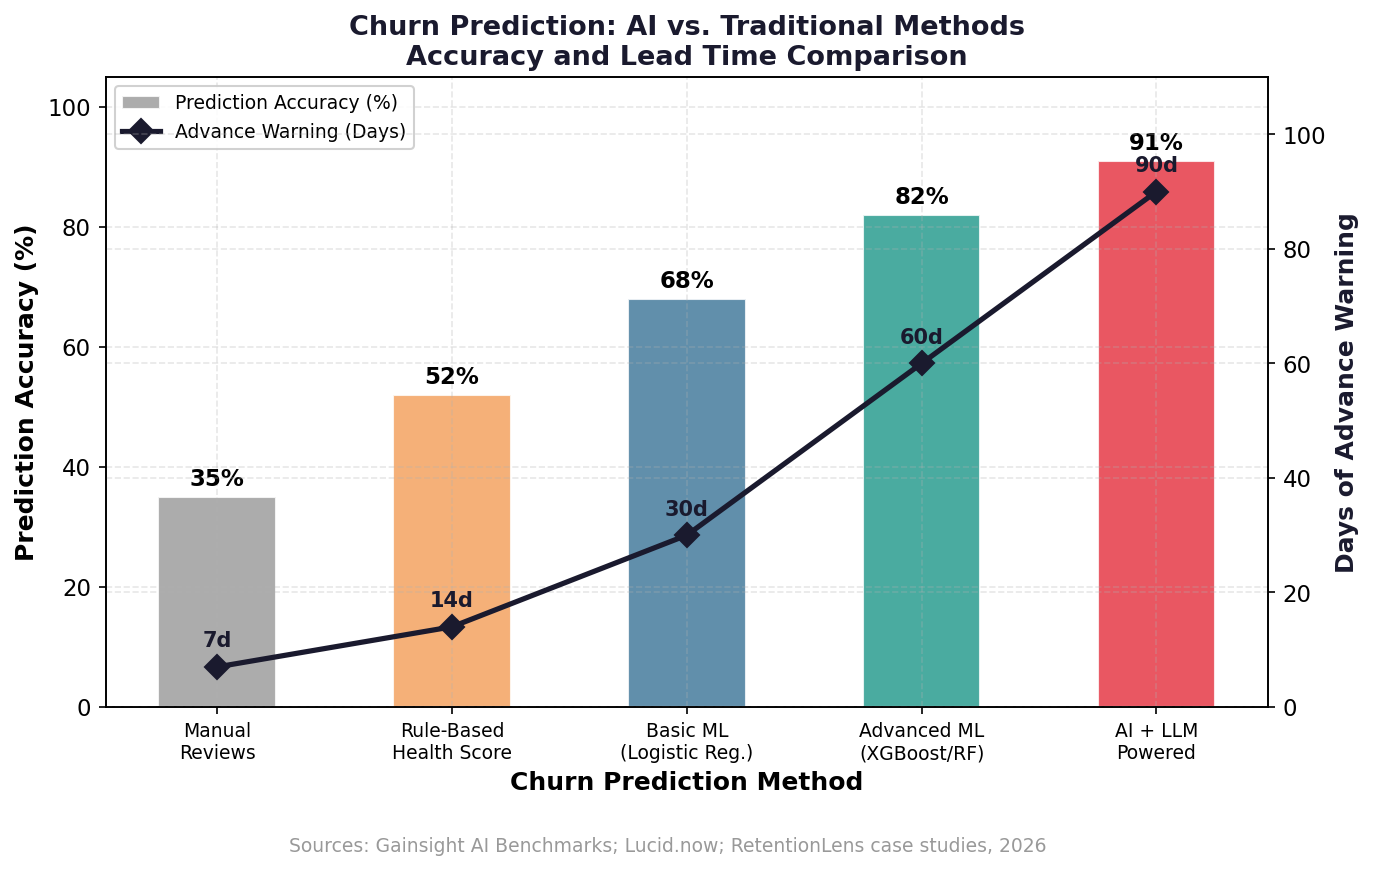
Companies using AI-powered churn prediction report 25–40% better retention rates compared to those relying solely on traditional methods. The most advanced systems achieve 85% accuracy in predicting at-risk users and provide 60–90 days of advance warning—enough time for meaningful intervention. When AI insights are combined with human judgment and CSM outreach, organizations achieve up to a 71% churn prevention rate.
AI Churn Prediction: Tools and Results
| Tool / Approach | Key Capability | Reported Results |
|---|---|---|
| Gainsight AI | Explainable Boosting Machines (EBM) for risk scoring | 95% renewal forecast accuracy; 25% CSM time savings |
| Salesforce Einstein | AI-powered risk alerts embedded in CRM | Real-time risk scoring integrated with sales workflows |
| RetentionLens | Predictive intelligence for at-risk identification | 40% annual churn reduction; $2.3M ARR saved in 6 months |
| Custom ML (XGBoost/RF) | Purpose-built models on product usage data | 82–85% accuracy; 50% reduction in annual churn (case studies) |
| AI + Human Hybrid | ML predictions + CSM intervention | 71% churn prevention rate |
Start simple, then scale. You don’t need a dedicated data science team to begin with AI-powered churn prediction. Start with a logistic regression model tracking 5–10 key behavioral signals (login frequency, feature adoption, support ticket sentiment, billing status). Graduate to random forests or gradient boosting (XGBoost) as your data volume grows. Most SaaS companies can deploy a basic churn prediction model within 2–4 weeks using tools like Scikit-Learn on their existing product analytics data.
11. Intervention Strategies: Saving At-Risk Customers
Predicting churn is only valuable if it triggers effective intervention. The most successful SaaS companies structure their interventions in tiers, matching the intensity (and cost) of the response to the severity and value of the risk.
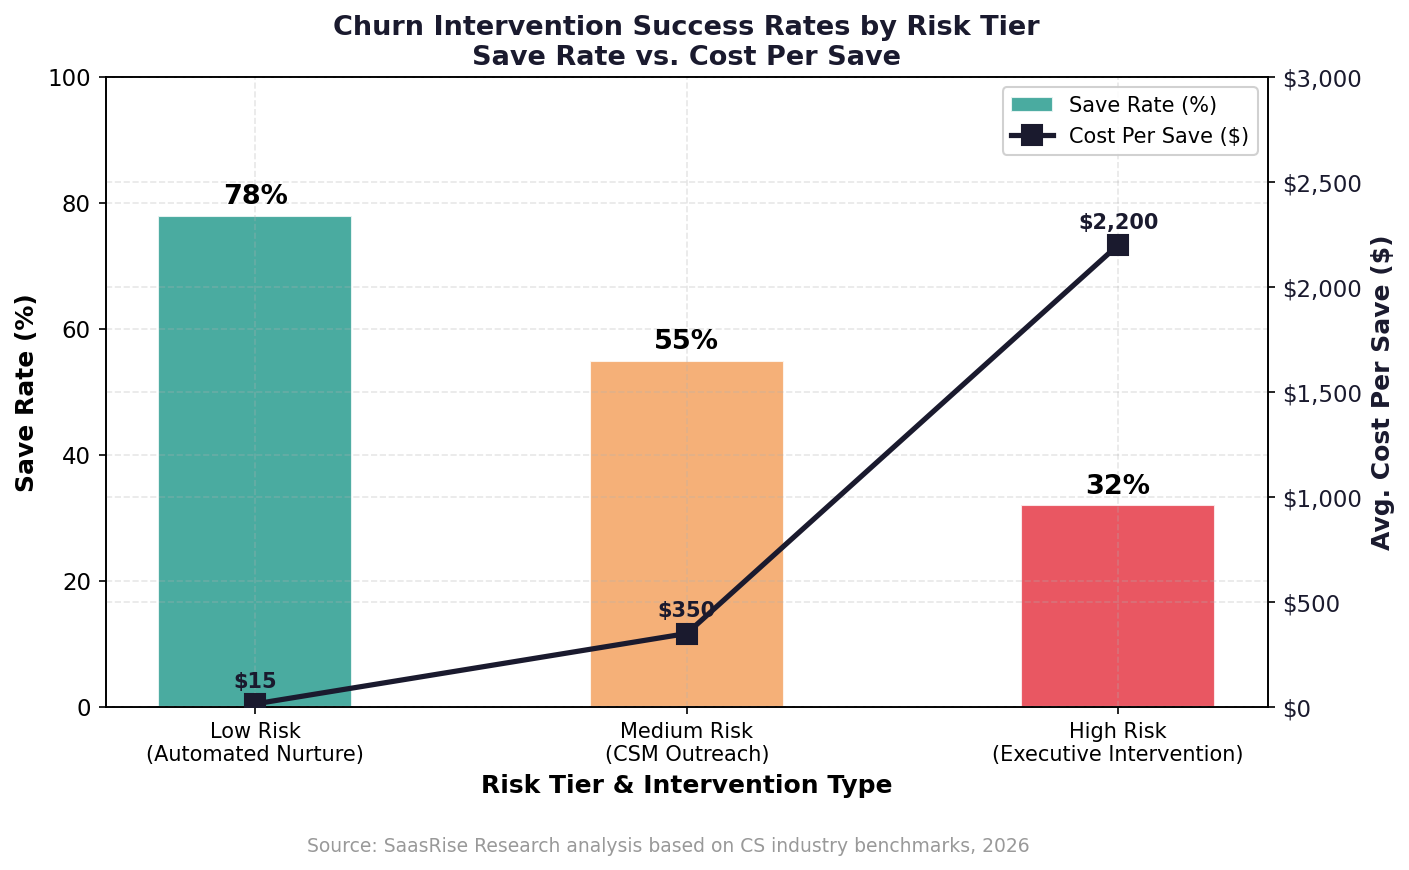
The economics of intervention are counterintuitive. Low-risk customers are the cheapest to save (automated triggers cost ~$15 per save) and have the highest success rate (78%). High-risk customers require expensive executive-level engagement (~$2,200 per save) with a lower 32% success rate. This means the highest ROI comes from catching customers early—before they reach the high-risk tier.
Three-Tier Retention Response System
- Tier 1 — Automated Nurture (Low Risk): In-app messages triggered by inactivity or milestone gaps. Behavioral emails at day 3, 7, and 14 of declining usage. Cost: <$15 per save. Save rate: 78%.
- Tier 2 — CSM Outreach (Medium Risk): Structured recovery sequence: CSM contacts both day-to-day user and economic buyer. QBR acceleration and personalized health checks. Cost: ~$350 per save. Save rate: 55%.
- Tier 3 — Executive Intervention (High Risk): Executive-to-executive engagement. Custom success plan with a 30-day milestone. Potential concessions: pricing, features, or contract restructuring. Cost: ~$2,200 per save. Save rate: 32%.
Case Studies: Churn Reduction in Practice
| Company | Starting Annual Churn | Strategy | Result |
|---|---|---|---|
| Groove | ~43% annual | Identified “Red Flag Metrics” (first session <2 min, <2 logins in 10 days); triggered targeted emails | 71% annual churn reduction |
| Mention | High (undisclosed) | Segmented support by customer value; launched use-case webinars | 22% reduction in 1 month |
| SEOAnt | 45% annual | Repositioned product toward better-fit audience (Shopify); improved onboarding | 78% reduction (to ~10% annual) |
| Rephrasely | 32% annual | Offered annual plan discounts in cancellation flow | 56% reduction (to ~14% annual) |
| Vertical SaaS | ~37% annual | Five-component system: dunning, onboarding, engagement scoring, CSM alerts, exec review | 68% reduction (to ~14% annual), $967K ARR saved |
Weekly SaaS CEO Masterminds
Join 300+ SaaS CEOs for weekly calls on growth, retention, fundraising, and exit prep. Hear from operators who have reduced churn by 40–70%.
Join SaasRise →