The 2026 SaaS Headcount Reset

What the 2026 SaaS org chart actually looks like: ARR per employee by stage, where AI is (and isn't) delivering real productivity gains, and how to run a headcount reset without breaking the business.

The 2026 SaaS Headcount Reset

By Ryan Allis, CEO of SaasRise · August 2026

The median B2B SaaS company now produces $193,000 of recurring revenue per employee, up 29% in a single year. R&D fell from 35% of revenue to 27%. The median seed-stage company has four people in it. This report lays out what a 2026 org chart actually looks like by stage and by function, what the evidence says about how much faster AI-assisted teams really work, where the cuts have landed, and how to tell whether your own efficiency number is a genuine productivity gain or just a smaller denominator.


SaasRise is a mastermind community for SaaS CEOs growing from $1M to $100M in ARR.


$193KMedian ARR per employee
27%Median R&D spend of revenue
4Median seed-stage team size

How to read the numbers in this report

Skip ahead if these are already on your dashboard.

ARR per employee is annual recurring revenue divided by full-time headcount. It is the single most-watched efficiency number in SaaS right now, and it moves for two very different reasons: revenue going up, or headcount going down. Half this report is about telling those two apart.

R&D, S&M and G&A as a percentage of revenue are the three spending lines a board benchmarks you on: engineering and product, sales and marketing, and everything else (finance, legal, HR, executive). They should sum to well under 100% if you intend to be profitable.

NRR is net revenue retention, what a cohort pays you this year against last year including upgrades and cancellations. GRR is the same calculation with upgrades removed, so it can never exceed 100%. Quota attainment is the share of sales reps who hit their number.

Where a benchmark is drawn from a specific survey, we name the survey and the sample size in the text. Two credible studies can disagree by 37% on the same metric, and section 2 explains why.

The org at a glance


Everything in this report expands on the table below. These are the 2026 medians for private B2B SaaS companies, drawn from Benchmarkit's 342-company survey and Carta's data on 60,000 startups. Find your ARR band, then read across.

Where you areUnder $5M ARR$5M–$20M$20M–$50M$50M+
ARR per employeeWell below the $193K median; $141K is the more realistic anchor at this sizeApproaching the median$282K — the peak across every band$206K above $100M, as layers come back
R&D, % of revenue32%Falling through the high twentiesMid twenties22% above $100M
S&M, % of revenue35% median across the survey; 44% for companies growing 31–50%; the top-spending quartile came down from 55% to 47%Same median, but the spread narrows as the motion matures
G&A, % of revenue22%Upper teensMid teens12% above $100M; the top quartile runs at or below 11%
Typical team size4 at seed, growing toward 2045 by Series B on averageRoughly 70–180131 average at Series D, down 29% from the 2023 peak
Growth to expect20% median across the survey, down from 30% in CY-2022. The 75th percentile fell from 75% to 42%. Median Rule of 40 is 25%.
What breaks hereEvery hire is 5% of the company. One wrong VP costs a year.The first management layer arrives and efficiency dips before it recovers.You are at peak efficiency and it will not hold by accident.Coordination overhead. Headcount grows on the org chart, not on the product.

Sources: Benchmarkit / Aleph 2026 B2B SaaS & AI-Native Performance Benchmarks (342 participants; N=96 for ARR per employee, 192 for R&D, 196 for S&M, 176 for G&A); SaaS Capital's 15th annual survey of 1,000+ private SaaS companies; Carta, State of Startup Compensation H2 2025. Bands without a published figure are described qualitatively rather than estimated.

Key findings


The efficiency gain is real and it is large, but it is concentrated: it shows up most clearly in engineering output and back-office cost, and barely at all in sales productivity. Team sizes at every venture stage are smaller than they were in 2023, and the reduction came mostly from hiring that never happened rather than from people who were let go. The companies with the best numbers in this report did not get there by cutting; they got there by never building the org in the first place. And the constraint has moved: at the company with the best-documented doubling of engineering output, the bottleneck shifted from writing code to reviewing it inside twelve months.

1. What actually reset in 2026

Start with the number everyone is quoting. Benchmarkit's 2026 benchmark report, run with Aleph across 342 SaaS companies, puts median ARR per employee at $193,000 for calendar year 2025. The prior year was $150,000. That is a 29% move in twelve months, and it is the largest single-year jump the survey has recorded. The top quartile went from $232,000 to $278,848, a 20% gain, which means the middle of the market closed some of the distance to the leaders rather than falling further behind.
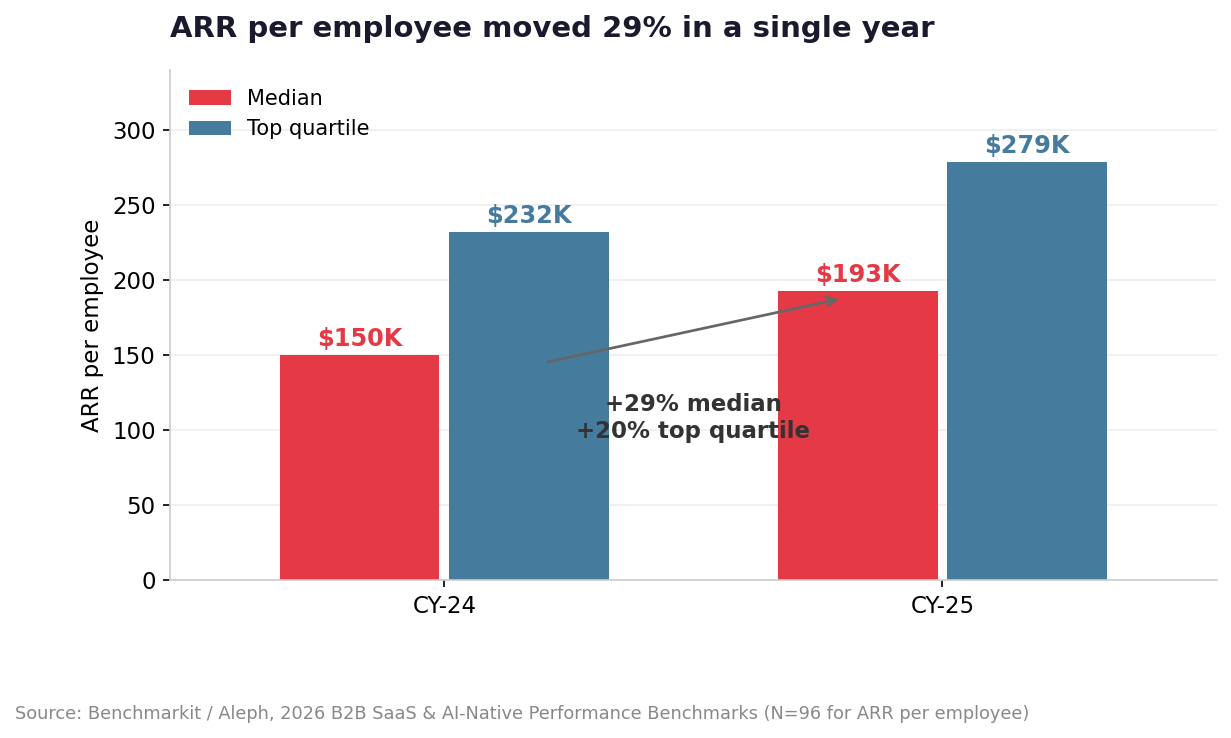
Median and top-quartile ARR per employee, CY-2024 versus CY-2025
The median moved further in one year than the top quartile did. Efficiency spread through the middle of the market rather than concentrating at the top.

Now the part that gets left out. The same report publishes two different figures for this metric. The executive summary, drawn from all 342 participants, says $175,000 and a 17% increase. The human-capital section, drawn from the 96 companies that answered the headcount questions, says $193,000 and 29%. Both are in the same PDF. We use the $193,000 figure throughout because it comes from the companies that actually reported employee counts, but you should know the range exists before you put a single number in a board deck. If your own figure lands between $175K and $193K, you are at the median by either measure.

The spending lines moved further and in the same direction. R&D dropped from 35% of revenue to 27% in one year across 192 companies, an eight-point fall. The 25th percentile now spends 22%, and the most efficient quartile has found a floor around 10%. G&A went from 24% of revenue in CY-2022 to 17% in CY-2025, with the top quartile at or below 11%. Sales and marketing came down from 37% to 35% — the first decline this survey has ever recorded on that line, and the fourth quartile of spenders pulled back hard, from 55% of revenue to 47%.
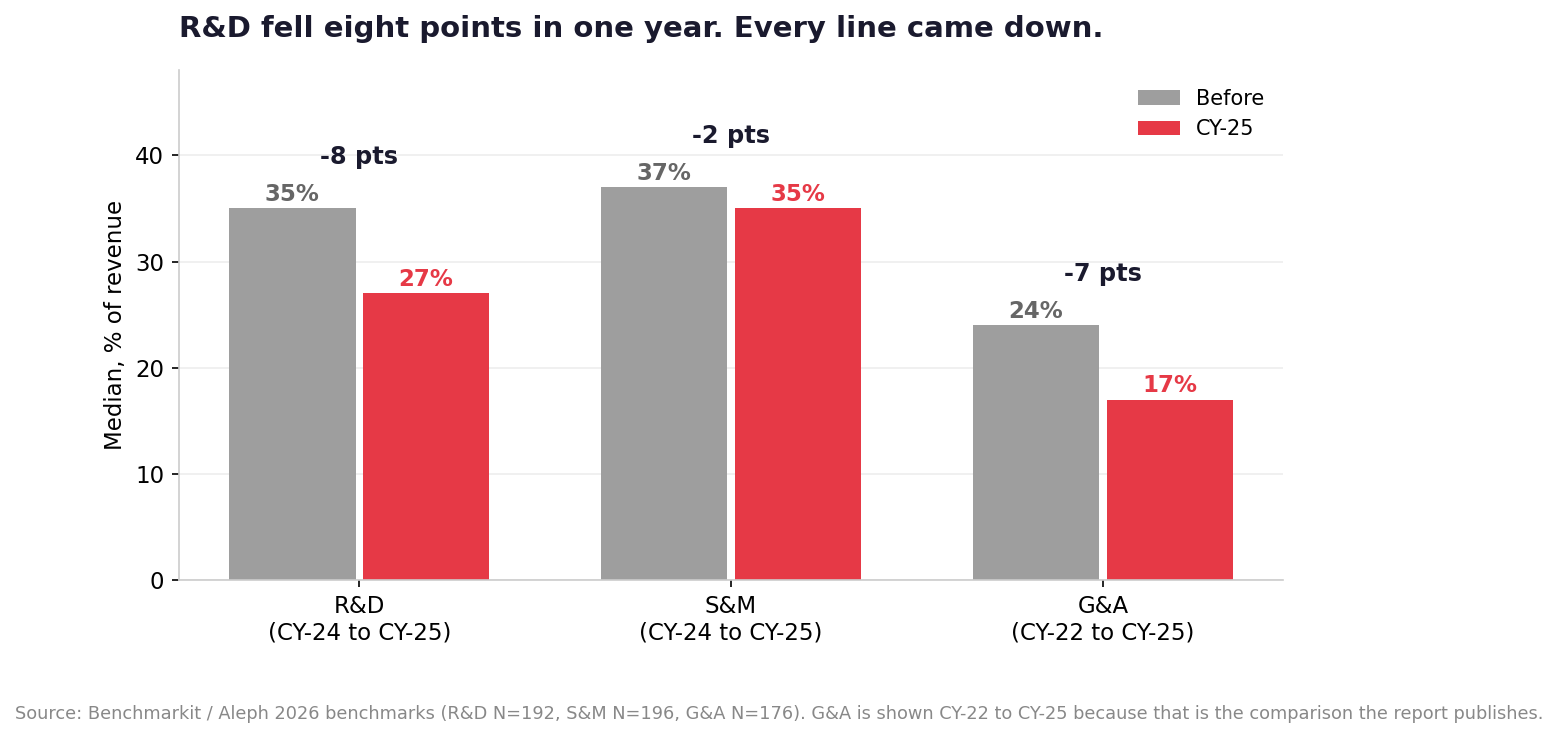
R&D, S&M and G&A as a percentage of revenue, before and CY-2025
Every operating line came down. R&D fell furthest and fastest.

Eight points of revenue off the R&D line is not a rounding error. On a $30M ARR company that is $2.4M a year, which at fully loaded cost is somewhere between twelve and eighteen engineers. Companies did not decide to build 8% less product. They decided the same product could be built by fewer people, and the market has mostly agreed with them.

Read the two numbers together. ARR per employee up 29% while R&D falls eight points tells you the gain is coming out of the engineering org more than anywhere else. If your own efficiency improved but your R&D ratio did not move, the gain came from somewhere else — probably a price increase or a churned-out cost base — and it will not repeat next year.

2. Your benchmark depends on whose survey you answered

Three credible organizations published a median revenue-per-employee figure for SaaS this year. They do not agree, and the gap between them is not small.
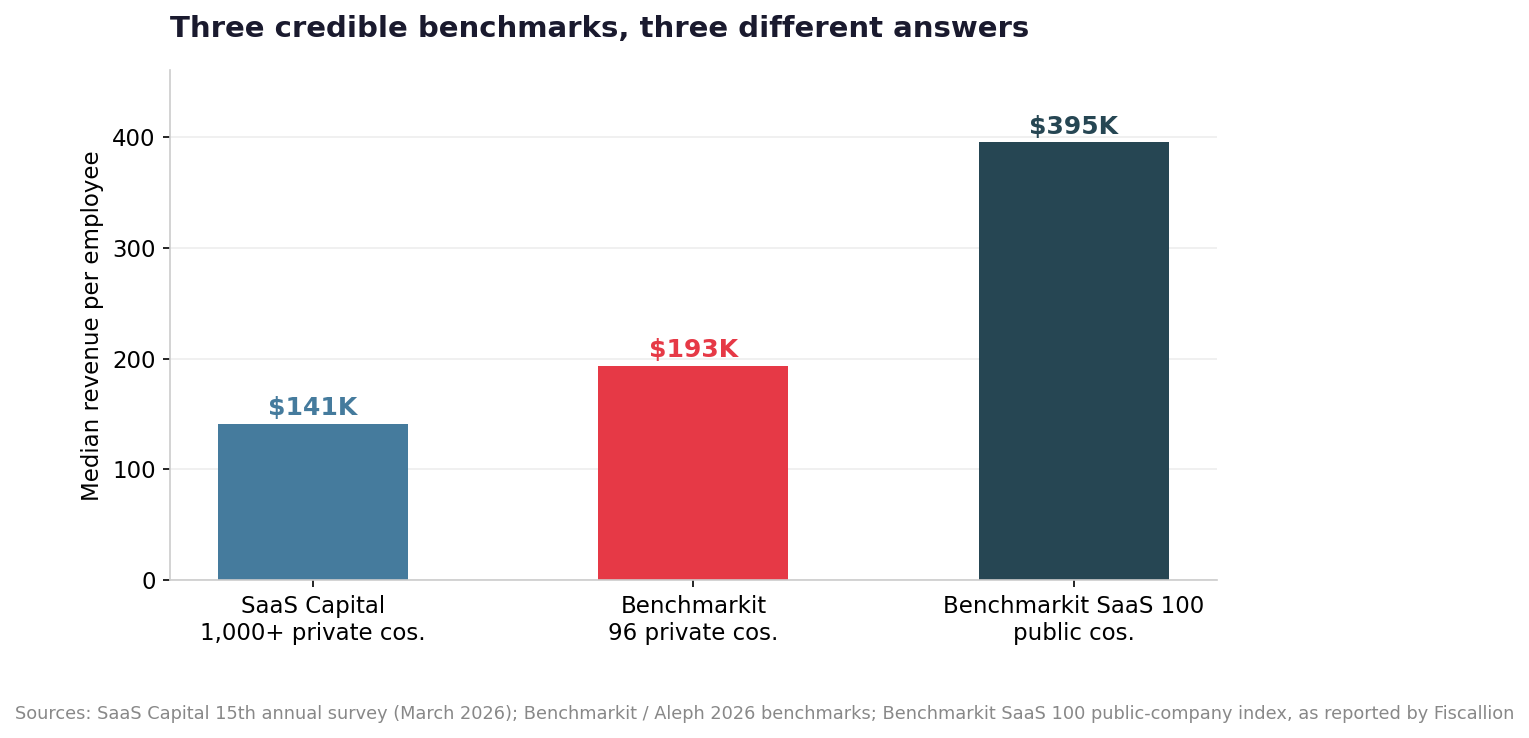
Median revenue per employee across three benchmark sources
Same metric, same year, three answers. The number you cite should match the population you belong to.

SaaS Capital's 15th annual survey, fielded in March 2026 across more than a thousand private B2B SaaS companies, puts median revenue per employee at $141,125, up from $129,724. Benchmarkit's number is $193,000. Public SaaS companies run near $395,000, based on Benchmarkit's SaaS 100 index of 134 public software companies, a figure we could only source secondhand and include for scale rather than as a target. All three are calculated correctly. They describe different companies.

SaaS Capital's sample skews smaller and includes a large bootstrapped population; Benchmarkit's skews toward venture-backed companies with dedicated finance teams who fill in benchmark surveys. Public companies sit at four hundred thousand because they have had fifteen years to build the leverage and because anything below scale has already been filtered out. If you are a $6M ARR company comparing yourself to $395,000 per employee, you are comparing yourself to a survivorship-selected set of the largest software businesses on earth.

The most useful cut in the SaaS Capital data has nothing to do with AI. At $5M to $10M of ARR, equity-backed companies produce $152,295 per employee. Bootstrapped companies at the same revenue produce $177,240. Bootstrapped companies are more efficient at every single band, and the spending data explains why: equity-backed companies spend 70% more on sales, 100% more on marketing, 64% more on G&A, 56% more on R&D and 100% more on customer success than their bootstrapped counterparts of identical size.

The practical version. Before you quote an efficiency benchmark to your board, say which survey it came from and how big the companies in it are. "We're at $160K per employee, against $141K for the SaaS Capital private-company median and $193K for Benchmarkit's venture-backed sample" is a defensible sentence. "We're below the SaaS benchmark" is not, because there are at least three of them.

3. The efficiency sweet spot is $20M to $50M in ARR

Efficiency is not a straight line up and to the right. It peaks and then gives some back.
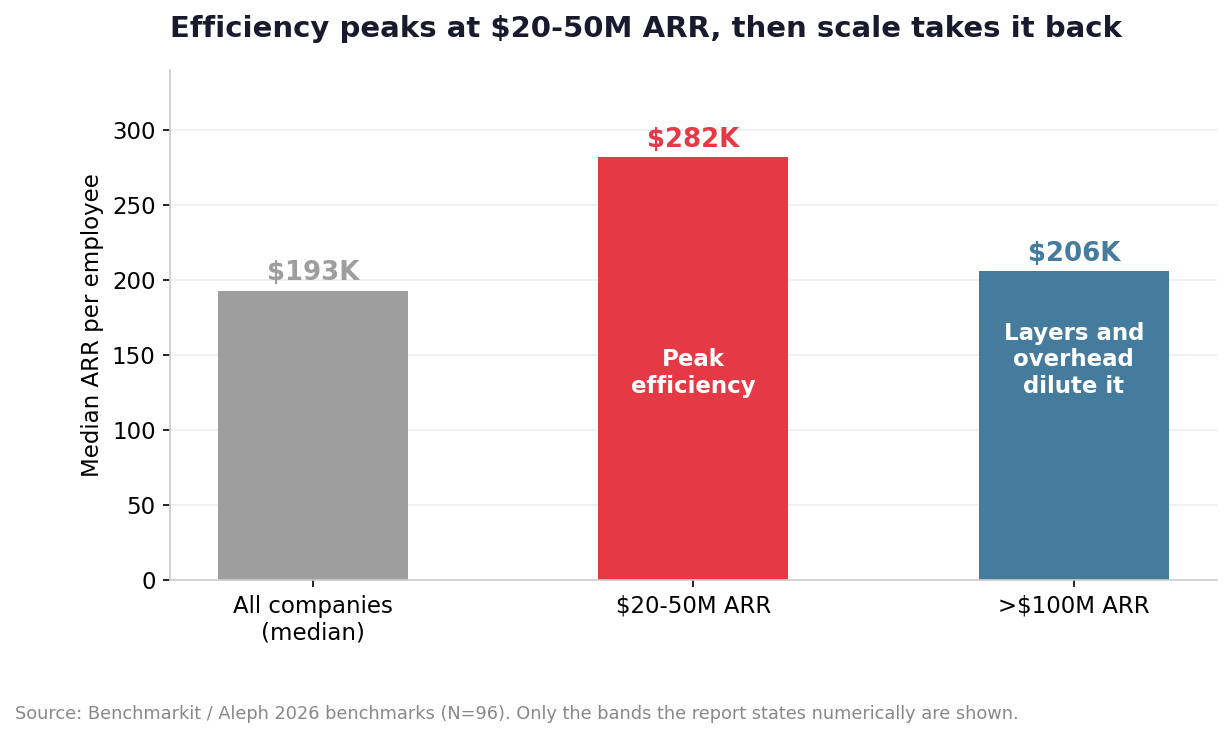
Median ARR per employee by ARR band
The band between $20M and $50M of ARR runs 46% ahead of the overall median, and 37% ahead of companies above $100M.

Companies between $20M and $50M of ARR run at $282,000 per employee. Companies above $100M run at $206,000. The bigger companies have more of everything — more product, more brand, more pricing power — and they are meaningfully less efficient per head. What sits between those two bands is management. Directors of directors, an enablement function, a program office, a second sales operations hire, a compliance team. None of it is wasteful on its own and all of it dilutes the ratio.

A second cut in the same data is more surprising and more useful. Sort the companies by growth rate rather than size, and the ones growing faster than 50% produce $235,000 per employee, while the ones growing 31% to 50% produce $136,000. The slower-growing cohort is the least efficient group in the survey. That is the shape of hiring ahead of a curve that then flattened: the headcount landed on the payroll, the revenue did not arrive on schedule, and the ratio broke. If you are growing in the thirties and your efficiency is poor, you probably built for growth in the sixties.

Pricing model matters too. Companies on usage-based pricing come in at $291,000 per employee against the $193,000 median. Some of that is the model — usage revenue expands without a salesperson touching it — and some of it is that usage-based companies tend to be newer and were designed with smaller teams from the start.

Compare your org chart to the room

SaasRise members put their real headcount, spending ratios and efficiency numbers side by side with other SaaS CEOs at the same stage, before an investor or an acquirer does it for them.

4. Team size by stage has been rebuilt

Carta's State of Startup Compensation report, published in May 2026, covers 60,000 startups and more than a million employees. It is the best available picture of how big a company actually is at each funding stage, and the picture has changed.

Employees by funding stage, 2023 peak versus 2025
Series D companies carry 54 fewer people than they did at the 2023 peak. The median seed company has four.

The median seed-stage company employs four people. Not four engineers plus a founder — four people in total. (Carta's own 2026 summary of the same dataset puts the current figure at five, so read this as four to five and falling, not as a precise count.) Series B companies average 45 employees, down from 53. Series D companies average 131, a 29% reduction from the 2023 peak of 185.

Fewer people, paid more. Initial equity grants for individual contributors are up 11% and salaries up 6.4% over two years. For AI and machine learning engineers the median equity grant rose 31% between January 2024 and February 2026, with salaries up 9.1%; at companies valued between $1M and $10M, AI engineer grants are up 64%. The market did not stop paying. It stopped paying for volume.

The hiring data underneath is the part worth sitting with. In January 2026, startups on Carta's platform made 26,030 hires against 20,378 departures. That is 1.3 new hires for every person who left. In January 2022 the ratio was 3.8. It was the slowest January for startup hiring since 2018, running 65% below the 2022 peak.
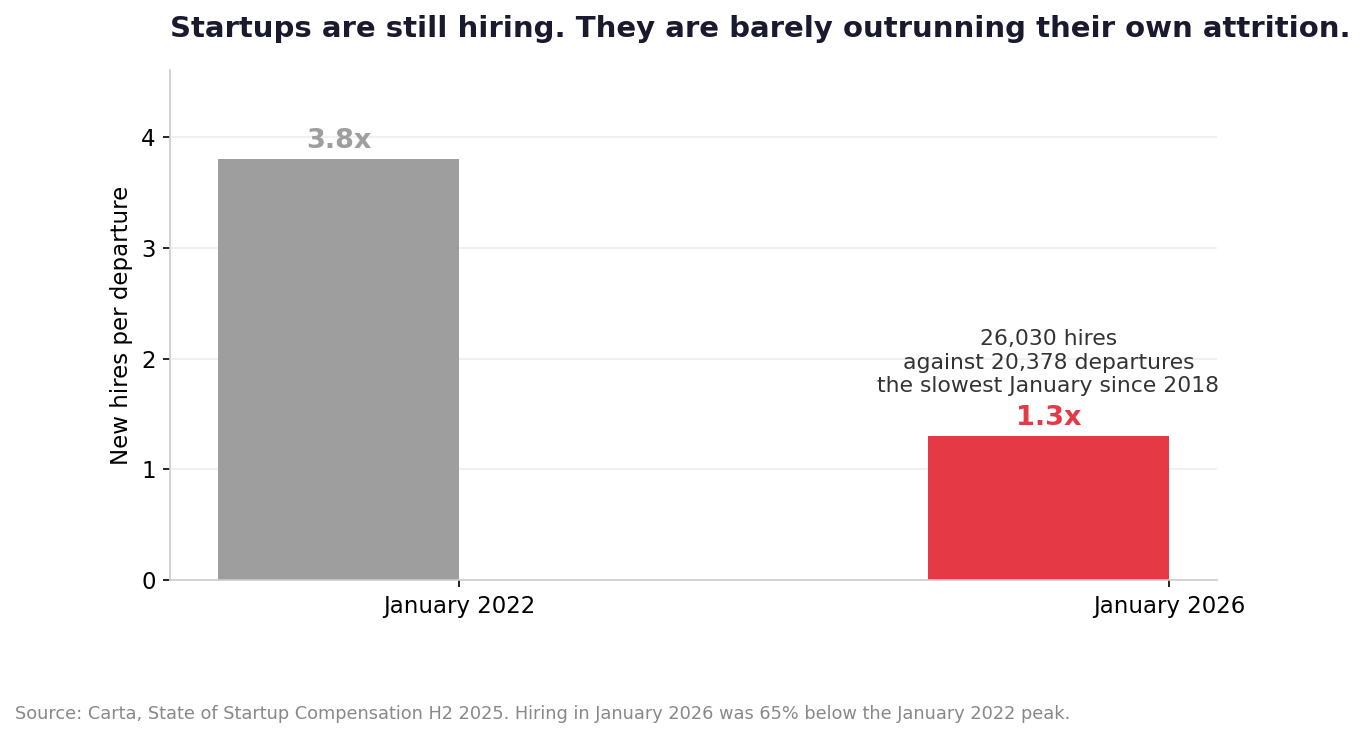
New hires per departure at startups, January 2022 versus January 2026
In January 2022 startups made almost four hires for every departure. In January 2026 they made 1.3.

Two other lines in the same dataset complicate the layoff narrative. Voluntary departures are down 40% from their June 2022 level, and layoffs are down 57% from January 2023. People are not being pushed out at anything like the 2023 rate, and they are not leaving voluntarily either. The org is not shrinking through the exit door. It is shrinking because the front door barely opens.

What this does to your recruiting. If nobody is leaving voluntarily and everyone is hiring at a trickle, the senior person you want is not on the market and is unlikely to run a process. Referral and direct outreach have gone from a nice-to-have to the whole channel. Budget for a longer, quieter, more personal search than you ran in 2022, and expect the good candidate to be employed and comfortable.

5. What the evidence says about AI and speed

Every number in the first half of this report describes an output. This section is about the input everyone assumes is behind it. The question a CEO actually needs answered is narrow: if my engineers use AI tools well, how much more do they ship, how long does it take to show up, and does the quality hold?

There are now six large studies with real answers, and they point the same way.
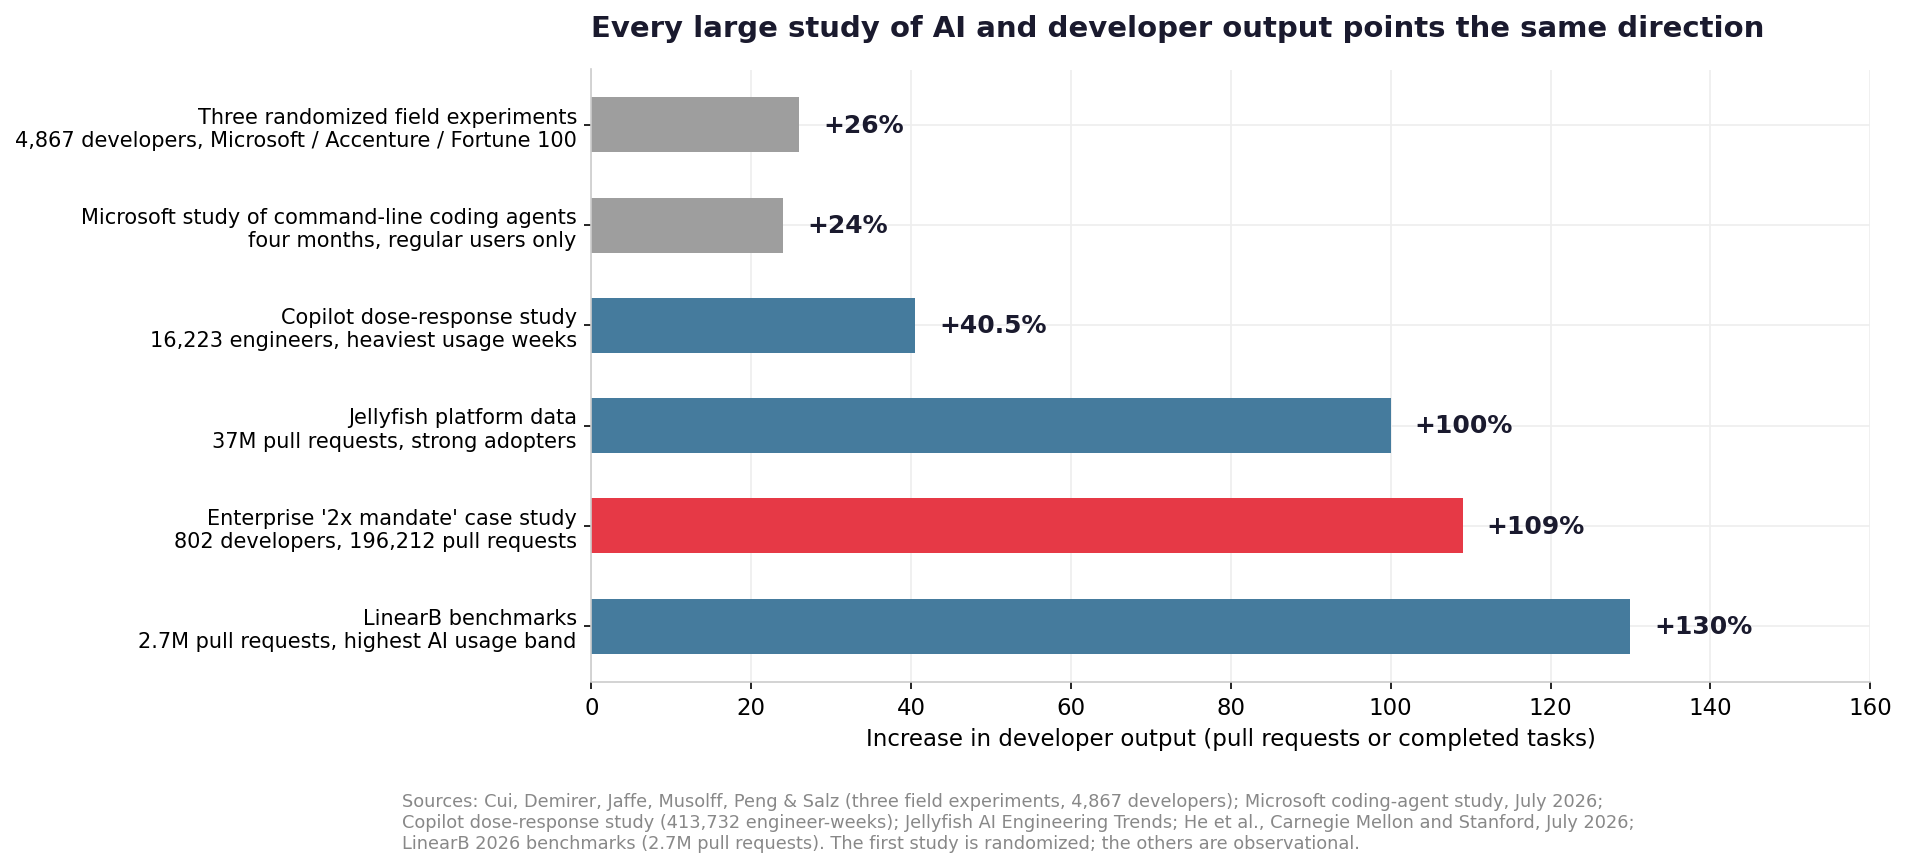
Measured increases in developer output across six large studies
Gains range from 24% to more than double, depending on how heavily the tools are used and how long the team has had them.

Start with the strongest design. Cui, Demirer, Jaffe, Musolff, Peng and Salz ran three randomized field experiments at Microsoft, Accenture and an anonymous Fortune 100 company, covering 4,867 developers. Access to an AI coding assistant was randomly assigned, which means the result is causal rather than correlational. Developers using the tool completed 26.08% more tasks per week, with a 38.38% increase in the number of times code was compiled. The gains were largest among the less experienced developers, who also adopted the tools fastest.

Then the study that shows what happens when a whole company commits. Researchers from Carnegie Mellon and Stanford spent two years inside a mid-sized, AI-forward company that had publicly committed to doubling merged pull requests per engineer. They built a panel of 802 developers and 196,212 pull requests running from January 2024 to April 2026. Per-capita throughput reached 2.09 times the pre-mandate baseline. It is the largest gain documented from a real enterprise deployment.

Three things about that result matter more than the headline.

Quality held. Merge rates and revert rates stayed flat across the whole period. The doubled output shipped without a measurable increase in code being rolled back. That is the first question a serious board member will ask, and the answer in the best-documented case is that the extra code was not worse.

The gain took nine months. Traced month by month, the adoption effect was 1.51x at three months, 1.55x at six, and 1.99x at nine. It is a curve, not a switch.
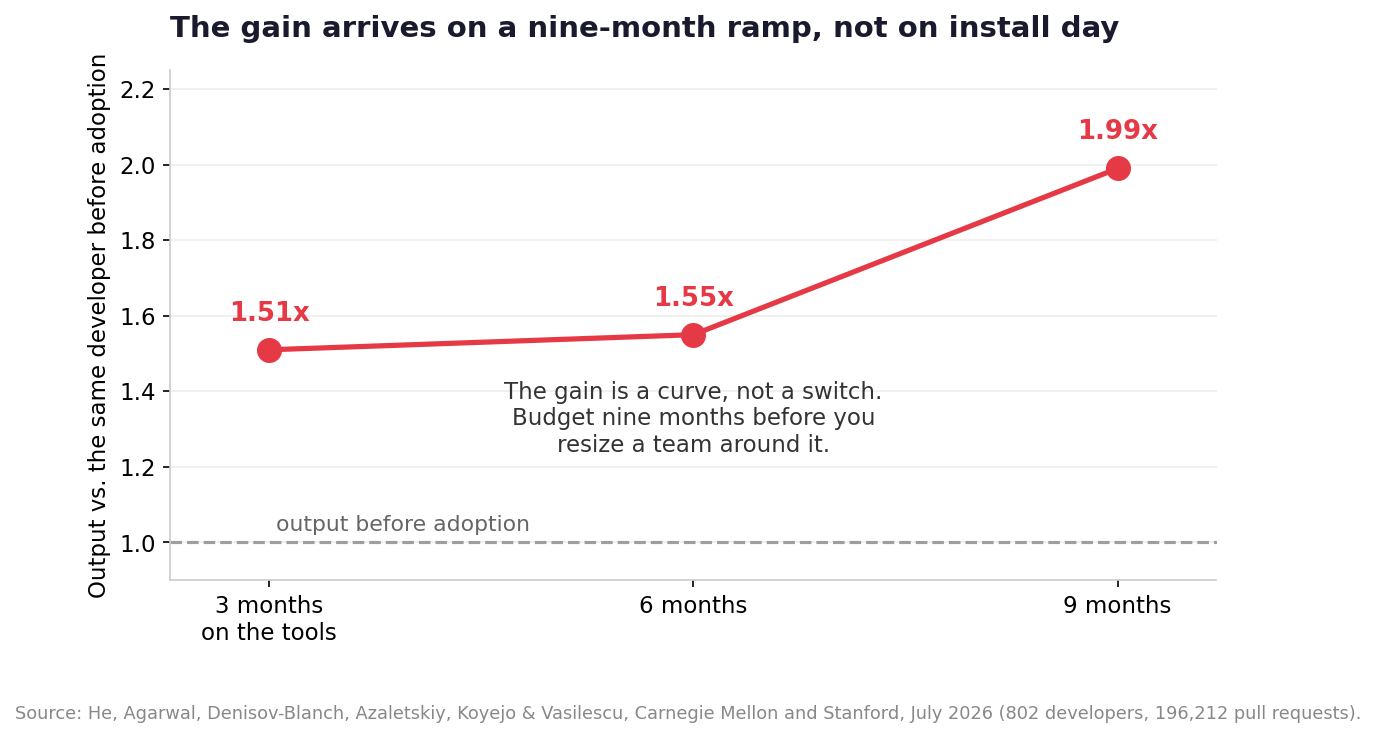
Output multiple by months since AI tool adoption
Nine months from adoption to a doubling. A CEO who resizes a team in month two is banking a gain that has not arrived.

The gain was flat across seniority. Statistically indistinguishable from individual contributors up to principal engineers. But it was concentrated in newer repositories and barely present in legacy code, which is the finding that should shape your expectations if your product is eight years old.

The other four studies fill in the range. An observational study of 16,223 engineers across 413,732 engineer-weeks found 40.5% more pull requests in a developer's heaviest AI-usage weeks compared with their zero-usage weeks, holding measured coding time constant; the gradient was monotonic, at 21% for light usage and 39% for moderate, with diminishing returns at the top. A Microsoft study published in July 2026 found command-line coding agents lifted merged pull requests 24%, with a confidence interval from 14.5% to 33.7%. LinearB's benchmarks, drawn from 2.7 million pull requests across 253 organizations, found developers in the highest AI-usage band merging code at 2.3 times their June 2025 rate while developers using no AI stayed flat. Jellyfish, looking at 37 million pull requests, sees roughly 2x for strong adopters and 30% to 60% for teams with modest adoption — which is the more encouraging finding, because it says there is value across the adoption curve rather than only at the extreme.

Google's DORA research, covering roughly 5,000 technology professionals, reported in its 2025 edition that AI adoption now shows a positive relationship with software delivery throughput. The prior year's edition had found the opposite. Teams learned how to use the tools.

The number to actually plan against

Stanford's software engineering productivity group has the largest dataset of all, roughly 120,000 developers analyzed through git history rather than survey. Their headline is more moderate: a median lift around 10% to 15%. The breakdown is the part you should write down, because it explains every disagreement above.

Type of workMeasured productivity gain
New code, low complexity30–40%
Existing codebase, low complexity15–20%
New code, high complexity10–15%
Existing codebase, high complexity0–10%

If your engineers spend their days adding features to a greenfield product, the top of that table is your number and the 2x results are within reach. If they spend their days in a complicated eight-year-old codebase with an ORM someone wrote in 2019, the bottom of the table is your number, and promising the board a doubling will end badly. Most SaaS companies between $5M and $50M of ARR are somewhere in the middle, doing new work in old systems.

The bottleneck moved to review

The most useful finding in the two-year enterprise study is not the 2.09x. It is what happened downstream of it. AI-authored pull requests grew to roughly 90% of the total and raw volume rose 3.1 times over the early-2025 baseline. The pool of people doing code review only grew 1.5 times. Per-reviewer load doubled.

The organization absorbed the gap by handing review to machines. The share of pull requests getting at least one human review fell from 89% to 68%, while the share getting an automated AI review climbed from about 19% to about 84%. The paper's title says it plainly: AI writes faster than humans can review.

What this means for how you size an engineering org

  • The constraint is no longer writing code. If you cut engineers, cut on the authoring side and keep your senior reviewers. They are now the throughput-limiting resource.
  • Automated review is not optional at 2x volume. The one company that doubled output did it by putting AI review in front of nearly every pull request. If you double the input without that, you get a queue.
  • Senior engineers get more valuable, not less. Judgment about what should merge is the scarce input. The 2026 org needs a higher ratio of people who can evaluate code to people who can produce it.
  • Budget nine months. Every study that measured a ramp found one. Announcing a headcount plan built on gains you have not yet realized is how a reset turns into a rehire.

Scale revenue before you resize the org

An efficiency number that improves because revenue grew is worth far more than one that improves because headcount fell. The SaasRise Growth Agency builds customer acquisition through digital advertising for SaaS companies scaling toward a raise or an exit.
6. Where the cuts have actually landed

The macro data does not show a workforce being replaced. It shows a door that stopped opening for one specific group.

Brynjolfsson, Chandar and Chen at the Stanford Digital Economy Lab analyzed ADP payroll records covering millions of American workers through June 2026. They found no evidence of widespread AI-driven job displacement. What they did find: workers aged 22 to 25 in the occupations most exposed to AI are employed at a rate roughly 19% below where the trend says they should be. Workers of the same age in less-exposed roles show no such gap. Experienced workers in the same exposed occupations show no such gap either.

The mechanism is reduced hiring, not increased firing. Nobody let these people go. They were never brought on. The adjustment is happening through employment levels rather than wages, which is what you would expect when a company decides a task no longer needs a junior person rather than deciding a junior person is worth less.

Salesforce is the clearest single illustration. The company cut roughly 4,000 customer support roles. Engineering hiring is described as mostly flat at around 15,000 people. Sales is still hiring. Support work was the most automatable, engineering became more productive so headcount stopped growing, and the revenue-generating function kept expanding. Three different outcomes inside one org chart, and none of them is "AI replaced our workforce."

Support is the function where the work genuinely disappears, and section 8 has the cleanest published example of it: Intercom absorbed a 300% increase in support demand without a proportional increase in headcount, and puts the hires it avoided at more than a hundred. Note the verb. It avoided hires. It did not run a layoff.

The broader layoff numbers are worth keeping in proportion. Layoffs.fyi tracked 125,759 tech layoffs across 264 companies between January 1 and August 6, 2026. That is already above the 122,606 recorded across all of 2025, but below the 152,922 of 2024, at an average of 476 people per event. The trend is elevated and it is not unprecedented.

The five-year problem. If the industry stops hiring 22-to-25-year-olds this year, it has no 27-to-30-year-olds to promote in 2031. The Bridge Group's 2026 sales research already found average ramp time at 6.2 months, the highest in the study's history, and concluded that the era of the junior account executive appears largely over. Every company benefits individually from skipping the junior hire. The industry does not.

7. Sales is where the efficiency story gets thin

The engineering evidence is strong. The sales evidence is not, and that gap should shape where you take headcount out.

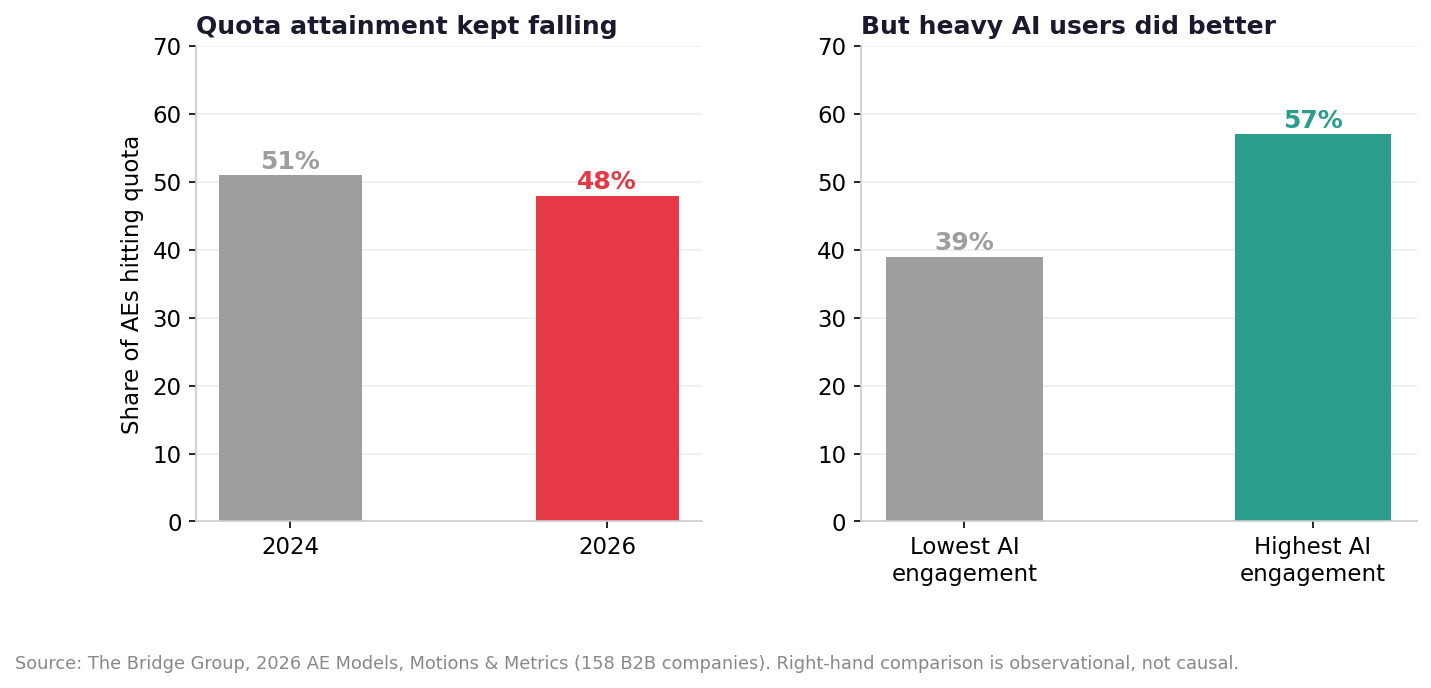
The Bridge Group's tenth biennial study of account executive models, covering 158 B2B companies, found 48% of reps hitting quota in 2026, down from 51% in 2024. Median on-target earnings rose to $200,000 from $190,000 in 2024 and $167,000 in 2022. Median quota rose to $960,000, and $875,000 for SaaS specifically. The quota-to-OTE ratio widened from 4.2x to 4.6x, meaning reps are being asked to carry more revenue per dollar of compensation than they were two years ago, and fewer of them are making it.

Quota attainment 2024 versus 2026, and by AI engagement tercile
Attainment fell overall. Within the same study, the reps using AI most heavily hit quota at 57% against 39% for the lightest users.

The right-hand panel is the one people quote, so it needs a caveat attached every time. Reps in the top third by AI engagement hit quota at 57%; reps in the bottom third at 39%. That is an eighteen-point spread and it is observational, not causal. Good reps adopt new tools. Reps who are already hitting quota have time to experiment. The study cannot separate the tool from the person holding it.

What the same research found about the tools themselves is more sobering: of eleven AI use cases surveyed, ten were rated "hit or miss" by the companies using them. The reliable ones are call summaries and email personalization. Sales is not yet seeing the kind of measured, repeated, quality-neutral output gain that engineering is.

The operating conclusion. Taking capacity out of an engineering org in 2026 has a body of evidence behind it. Taking capacity out of a sales org because AI will cover the difference has one observational tercile comparison behind it. Those are not the same bet, and boards increasingly ask companies to make both at once.

8. Companies that ran it differently

Public examples are easy to source and their constraints do not match yours. Most of the companies below are private. Some never had a headcount to reset, one hired as fast as it could, and one of them will tell you the lean version was a mistake. Every figure here is self-reported by the company unless noted, because private companies do not file. Treat them as existence proofs, not benchmarks.

Gamma: $100M ARR with about 50 people

Gamma passed $100M in annual recurring revenue with roughly 50 employees, which works out to about $2M of revenue per person, more than ten times the Benchmarkit median. CEO Grant Lee says the company has been profitable for over fifteen months. It has raised around $90M in total, including a $68M Series B led by Andreessen Horowitz at a $2.1 billion valuation, and ran a $20M employee secondary so people could take money off the table without an exit. There was no traditional sales team for most of that run.

Then read what Lee said about it on stage at SaaStr in July 2026, because it is the more useful half of the story. He describes the no-sales-team period as something that worked and also cost them. Sales at Gamma began as cleanup rather than strategy. He hired reps only when the inbound got embarrassing, when people were writing in asking how to buy for a whole department and nobody was there to answer. The company also shipped its paid product with no billing behind it and spent two weeks reverse-engineering pricing mid-surge while demand sat on the table. And by his own account they still have not gone back to expand the 600,000 paying self-serve subscribers already in their database.

His diagnosis of the pattern is worth quoting to your own team: self-serve growth is so good at generating signal that you stop generating decisions. A lean org is not a decision-free org. It is an org where each remaining person has to make more decisions, sooner.

Lovable: $500M ARR with 146 people, and then the lean phase ended

Lovable's chief revenue officer put the company at $400M of ARR with 146 full-time employees in March 2026, alongside the claim that it had added $100M of revenue in a single month. By June the company said it had passed $500M on the same 146 people, roughly $2.77M each. In August it raised a $400M Series C at a $13.3 billion valuation, said it was tracking toward a run rate near $600M, and announced it would grow headcount by 50% to about 450 people this year.

That last sentence is the one nobody quotes, and it is the one that matters to you. The most extreme efficiency ratio in software was a phase, not a destination. Lovable is spending the round on the things a small team could not carry: reliability, security, support and geographic expansion. The ratio bought them the right to choose when to add people. It did not remove the need to.

Remote: revenue per employee up 50% with no cuts

Remote is the most transferable of the four because it is a real operating business with a large existing team. It passed $300M in ARR and grew revenue per employee 50% without adding net headcount and without laying anyone off. Engineer contributions rose 60% year over year. The company says more than 85% of all of its code is now written by AI.

That last sentence is the one to sit with. The same efficiency outcome that ClickUp and monday.com reached by cutting, Remote reached by holding headcount flat and letting revenue grow into it. Both produce a better ratio. Only one of them keeps the institutional knowledge, the recruiting reputation, and the ability to accelerate when the market turns.

Intercom: 81% of its own support automated, and 100 hires never made

Intercom is the most concrete published example of AI removing a specific quantity of work, and it comes with a number attached. Its support director published the internal figures in March 2026: Fin, the company's own AI agent, now resolves more than 81% of all customer support volume. Support demand rose more than 300% since 2022, and the team absorbed it without proportional headcount growth. Without the agent, Intercom says it would have needed at least 100 additional support people to hold the same service levels, a saving it puts at $7.5M to $9M a year.

Two things make it worth studying rather than dismissing as vendor marketing. First, nobody was laid off; the savings are hires that never happened, which is the cheapest and least destructive form of this entire reset. Second, the path was slow and unglamorous. Fin started at a resolution rate just over 25% and got to 81% over three years, and the thing that moved it was not the model. It was knowledge management. They converted their help center manager into a dedicated knowledge manager, embedded content creation into every product launch with a target that the agent could handle at least half of the questions on day one, and kept feeding it deeper documentation until it could take actions rather than just answer.

The transferable lesson: the deflection rate is downstream of your documentation. If your support content is thin, buying an agent buys you a 25% resolution rate and an unhappy customer base. The caveat: these are Intercom's own numbers about Intercom's own product, and the company sells the outcome it is reporting.

Enrich Labs: $18M ARR with 14 people, no funding

A Dubai SaaS studio, founded June 2024, that says it reached an $18M ARR run rate in 26 months with 14 full-time employees, profitable throughout, with no outside capital. That is about $1.29M per employee against the $193K median.

The org design is the part to copy, and it is unusually specific. Each of its four products is run by a three-person team: one engineer, one growth engineer, one product lead. Founder Rahul Lakhaney's framing is that they put as many people on getting the product to customers as on building it, and that distribution was engineered in from day one rather than bolted on later. Most companies that go lean cut GTM first and keep engineering intact. This one holds them at parity by design. Self-reported, unaudited, and a studio model rather than a single product, so read it as a structure to consider rather than a number to hit.

ElevenLabs: no product managers, engineers everywhere

ElevenLabs went from its first credible model in early 2023 to roughly $100M ARR in about twenty months, then $200M ten months later, then $300M five months after that, with a run rate near $600M by mid-2026. Its CEO says the company runs on teams of five to ten people and has never employed a product manager. Instead it embeds engineers in nearly every function, including legal, talent and go-to-market, where they build internal automation and help colleagues adopt AI safely.

Read that as an org-design claim rather than a headcount one: the coordination layer that usually grows fastest between $20M and $100M (program managers, enablement, project owners) got replaced by engineers embedded in the function itself. It is the practical version of the finding in section 3 that what dilutes the efficiency ratio in the middle bands is management, not makers.

fonio.ai: the AI-native company that hired as fast as it could

This one is the correction to everything above it. The Vienna voice-AI company says it passed $10M ARR in under twelve months, growing more than 30% a month since switching to subscriptions. It also went from its first hire in June 2025 to about 80 staff in fourteen months, with 52 more roles open and a stated target of 130 to 150 people by year end across ten markets.

Same category, same tooling, same year, opposite headcount strategy. Being AI-native does not mean staying small; it means you get to choose. fonio.ai chose to spend the efficiency on land grab. Its CEO also volunteered, unprompted, that net revenue retention is currently a little under 100% and that the goal is 110% by year end — which is a useful reminder that a spectacular growth rate and a durable revenue base are two different achievements.

ClickUp: cut 22% and put the money into salaries

ClickUp cut about 22% of its roughly 1,300 people in May 2026. What makes it worth studying is where the savings went: CEO Zeb Evans redirected them into salary bands reaching $1M for the people who stayed, describing the goal as a "100x org," with roughly 3,000 internal AI agents supporting the remaining team. It is the clearest statement of the strategy the whole reset implies — fewer people, each of them far more expensive and far more leveraged.

The public comparison set

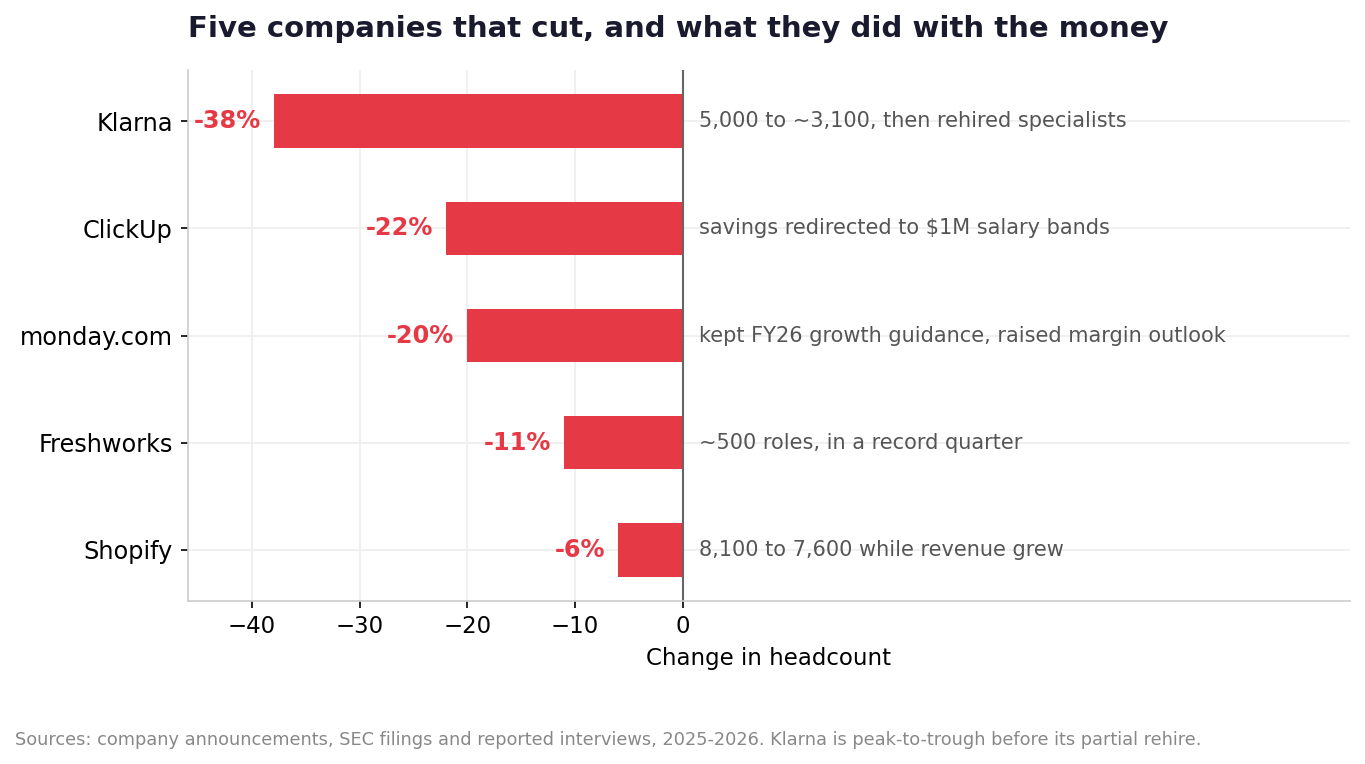
Headcount reductions at five well-known companies
Every one of these companies was growing revenue when it made the cut.

monday.com cut around 630 people, about 20% of its workforce, on July 22, 2026, while keeping its full-year revenue guidance of 19% to 20% growth and raising its margin outlook. Freshworks cut roughly 500 people, about 11%, in May 2026 and took a $7M to $9M charge, then reported a record second quarter with its Freddy AI Copilot attached to more than 71% of new enterprise deals. Shopify went from about 8,100 employees to about 7,600 over 2025 while Q2 2026 revenue grew 34%; CEO Tobi Lütke's 2025 memo requiring teams to prove AI could not do a job before requesting a hire is the policy version of everything in this report.

Klarna is the cautionary tale. AI handled two-thirds of customer service chats and headcount fell from about 5,000 toward 3,100. Then the company rehired a specialist team of around a hundred people after concluding it had cut too deep into quality. The reversal is the useful part: the deflection rate was real, and it still was not the whole job.

The reset works better when revenue is climbing

Remote hit the same efficiency ratio as the companies that cut, by growing into its headcount instead. The SaasRise Growth Agency builds the acquisition engine that makes that version possible.

9. The bear case

Five things could make everything above look naive within a year.

A rising efficiency ratio can be a warning. ARR per employee goes up when revenue rises and it goes up when headcount falls. Median growth in the same Benchmarkit survey is 20%, down from 30% in CY-2022, and the 75th percentile fell from 75% to 42%. A company that cut 20% of its staff while growth decelerated has a better efficiency number and a worse business. The metric cannot tell the difference. Your board can, if you show it both lines.

R&D at 27% might be a product deficit on a delay. An eight-point cut to engineering spend in a single year assumes the remaining team ships as much as the old one. The evidence in section 5 says that is achievable, but it takes nine months and it works far better on new code than on legacy systems. If a competitor is spending 33% of revenue on R&D — the median for companies growing above 50% in this same survey — the product gap does not show up in this year's numbers. It shows up in next year's win rates.

Most enterprises are not funding AI out of headcount. Battery Ventures surveyed enterprise technology buyers for its Q1 2026 spending report. Among companies funding AI purely by reallocation, 20% took the budget from other software, 9% from headcount and 3% from infrastructure. Asked directly about the effect on their workforce, 41% said they were shifting hiring toward AI-related roles, 32% said AI augments their teams without reducing headcount at all, 18% were freezing or slowing hiring, and 9% reported no effect. Only 1% said AI replaces workflows outright; 42% said it augments them and 53% said the picture is mixed. The buy side is not behaving as though it is about to fire everyone.

Cutting to prove the AI investment may destroy the gain you are trying to book. This is the newest and least comfortable finding in the report. An Atlanta Federal Reserve study found that roughly 90% of executives believe AI has not yet raised productivity at their own companies. Mark Ma and his colleagues, writing in August 2026, went looking for why. They analyzed millions of Glassdoor reviews against hundreds of AI investment and layoff announcements at US public companies over five years, and found that AI investment announcements and AI-attributed job cuts rise together, that employee sentiment toward AI is one of the strongest predictors of a firm's productivity when AI is in use, and that announcing AI-driven layoffs causes that sentiment to fall sharply. The market did not reward the cuts either: average stock reaction to the layoff announcements was close to zero, negative or flat for more than half of them.

The mechanism is not mysterious. You are asking the same people to adopt a technology and to compete with it in the same quarter. The evidence in section 5 is dose-dependent: the gains go to the people who use the tools heavily and daily. Frightened employees are not heavy daily users of the thing they believe is coming for their job. This is correlational work on public companies, not a controlled experiment on yours, but the direction is consistent enough to plan around: if you cut in the name of AI before the adoption curve has run, you may be buying the smaller denominator at the cost of the productivity that was supposed to justify it.

Retention is drifting in the wrong direction. Gross revenue retention across the survey fell from a median of 88% to 84%, and seat-based companies are running NRR of 95% to 98% while usage-based companies run 108%. If you cut customer-facing headcount into a softening retention number, the efficiency gain arrives about two quarters before the churn does.

Pressure-test the plan before you commit to it

The most expensive version of this reset is the one you reverse in six months. SaasRise members work through org and hiring decisions with CEOs who have already made them.

10. Running the reset

The benchmarks tell you where you stand. This section is about what to do on Monday.

Measure by function, not company-wide

Company-wide ARR per employee is the number your investors will quote and the least useful number you own. The evidence says engineering output has roughly doubled in the best cases and sales productivity has fallen. Averaging those together produces a figure that hides both. Track revenue per engineer, revenue per quota-carrying rep, accounts per customer success manager and revenue per G&A employee as four separate series. The one that is dragging is where the work is, and it is usually not the one you assumed.

Separate the numerator from the denominator, in writing

Every time you report an efficiency improvement, show it decomposed: how much came from revenue growth and how much from headcount reduction. Two companies can both report $220,000 per employee. One grew 40% and hired carefully. The other shrank 15% and grew 4%. If you do not decompose it yourself, an acquirer's diligence team will do it for you in the second week and you will spend the rest of the process explaining.

Run a ninety-day measurement protocol before you resize anything

The protocol

  • Weeks 1–2: set the baseline. Pull twelve months of history on merged pull requests per engineer, cycle time, revert rate, tickets resolved per support person, and pipeline generated per rep. You cannot show a gain without a before.
  • Weeks 3–12: measure use, not access. The Microsoft study found the productivity lift appeared only for developers who used the tools regularly; giving people licenses did nothing. Track actual usage intensity per person, because the gain is a dose–response curve.
  • Throughout: watch the quality proxies. Revert rate, change failure rate, escaped defects, support reopen rate. DORA's data shows AI adoption still carries a negative relationship with delivery stability even where throughput improved. If quality moves, the gain is not real yet.
  • Week 13: decide, and only about the next hire. The first decision an efficiency gain should change is whether you backfill an open role, not whether you cut a filled one. Attrition is the cheapest way to resize an org and nobody writes a press release about it.

What goes in the board deck

Three slides. First, your four functional efficiency series against the benchmark, with the survey named and the sample size on the page. Second, the decomposition: revenue contribution versus headcount contribution to any change. Third, the plan for what happens to the savings — because "we cut costs" is a one-year story and the board will ask what year two looks like.

Decide where the savings go, before you have them

ClickUp put the money into salaries. monday.com put it into margin and raised its outlook. Freshworks took a charge and reported a record quarter. All three are defensible. What is not defensible is banking the savings without a decision, because the market will price you on growth again, and a company with an excellent efficiency ratio and a 12% growth rate is not a venture story or an acquisition story.

The clearest rule anyone has published on this came from Shopify: before you approve a new headcount request, the team has to demonstrate why AI cannot do the job. It is a hiring filter, not a firing policy, and it is the version of this reset that does not require a layoff.

Protect the bottom of the pyramid, at least a little

The Stanford employment data and the Bridge Group's 6.2-month ramp both point at the same hole: the industry is not training juniors. Every individual company is right to skip the junior hire this year. Collectively that produces a senior talent shortage in 2031, and the companies that kept a small pipeline will be the ones who can staff it. One or two junior roles per function, with senior people given explicit time to supervise, is cheap insurance against a market you will be recruiting in for the next decade.

11. The 2026 org checklist

Before your next planning cycle

  • Calculate ARR per employee and compare it to the right population: $141K for the SaaS Capital private-company median, $193K for Benchmarkit's venture-backed sample. Say which one you are using.
  • Break out R&D, S&M and G&A as percentages of revenue and compare to 27%, 35% and 17%.
  • Split the efficiency series by function. Company-wide averages hide the problem.
  • Decompose every efficiency change into revenue and headcount contributions.
  • If you are between $20M and $50M of ARR, you are at peak efficiency for your size. It will not survive the next management layer unless you protect it deliberately.
  • If you are growing between 31% and 50%, check whether you hired for a faster curve than the one you got. That cohort is the least efficient in the survey.
  • Measure AI usage intensity per person, not licenses issued.
  • Track revert rate and change failure rate alongside throughput. A gain that costs quality is a loan.
  • Give any adoption program nine months before you plan headcount around it.
  • Protect senior reviewers. At 2x authoring volume, review is the constraint.
  • Decide what happens to the savings before you realize them.
  • Before buying a support agent, audit your documentation. Intercom's resolution rate went from 25% to 81% on knowledge management, not on model upgrades.
  • Do not announce a headcount cut as an AI result. The research says it collapses employee sentiment toward the tools, and sentiment is one of the strongest predictors of whether the productivity gain actually shows up.
  • Keep one or two junior roles per function open, with supervision time budgeted.

Run the numbers with people who have already run them

SaasRise is a mastermind community for SaaS CEOs growing from $1M to $100M in ARR. Members compare org design, spending ratios and efficiency benchmarks with peers at the same stage on weekly calls. GrowthRise brings the same room to B2B growth leaders, and the SaasRise Growth Agency scales customer acquisition through digital advertising for companies preparing to raise or exit.

Sources

  1. Benchmarkit and Aleph, 2026 B2B SaaS & AI-Native Performance Benchmarks (342 participants; N=96 for ARR per employee, 192 for R&D, 196 for S&M, 176 for G&A); full report PDF
  2. Aleph, summary of the 2026 Benchmarkit gross margin and efficiency data
  3. SaaS Capital, Revenue Per Employee Benchmarks for Private SaaS Companies, 15th annual survey, fielded March 2026 (1,000+ private B2B SaaS companies)
  4. Fiscallion, Revenue per employee in SaaS (reporting the Benchmarkit SaaS 100 public-company index figure)
  5. Carta, State of Startup Compensation H2 2025, published May 2026 (60,000 startups, 1M+ employees)
  6. Cui, Demirer, Jaffe, Musolff, Peng and Salz, The Effects of Generative AI on High-Skilled Work: Evidence from Three Field Experiments with Software Developers (4,867 developers at Microsoft, Accenture and an anonymous Fortune 100 company)
  7. He, Agarwal, Denisov-Blanch, Azaletskiy, Koyejo and Vasilescu (Carnegie Mellon and Stanford), AI Writes Faster Than Humans Can Review: A Longitudinal Study of an Enterprise "2×" Mandate, July 2026 (802 developers, 196,212 pull requests)
  8. GitHub Copilot and Developer Productivity: An Observational Dose-Response Analysis (16,223 engineers, 413,732 engineer-weeks)
  9. TechRepublic, Microsoft Study Finds AI Coding Agents Lift Pull Requests by 24%, July 2026
  10. LinearB, The AI engineering productivity gap: 2026 benchmarks (2.7 million pull requests, 83,000 developers, 253 organizations)
  11. Jellyfish, The AI Divide Is Growing: What 37 Million PRs Reveal About Engineering's Future, April 2026; 2026 State of Engineering Management
  12. Denisov-Blanch et al., Stanford Software Engineering Productivity Research Group, Does AI Actually Boost Developer Productivity? (~100,000 developers); ongoing results
  13. Google Cloud, Announcing the 2025 DORA Report, and the 2025 State of AI-assisted Software Development Report (~5,000 respondents)
  14. Brynjolfsson, Chandar and Chen, Stanford Digital Economy Lab, Canaries in the Coal Mine? Six Facts about the Recent Employment Effects of Artificial Intelligence, August 2026 (ADP payroll data through June 2026)
  15. The Bridge Group, 2026 AE Models, Motions & Metrics (158 B2B companies, tenth biennial edition)
  16. Battery Ventures, State of Enterprise Tech Spending, Q1 2026
  17. Mark Ma and The Conversation, in Fortune, 90% of executives say AI hasn't boosted productivity. Some are still cutting jobs, August 2026 (citing an Atlanta Federal Reserve executive survey and the authors' own analysis of Glassdoor reviews against AI investment and layoff announcements)
  18. Fortune, Salesforce support, engineering and sales headcount, May 2026
  19. IBTimes, tech layoff totals for 2026 to date, citing Layoffs.fyi
  20. The Next Web, Gamma's $100M ARR with about 50 employees; SaaStr, Grant Lee on why getting to $100M ARR without a sales team worked, and why it was a mistake, July 2026
  21. TechCrunch, Lovable at $400M ARR with 146 employees, March 2026; The Next Web, $500M ARR on the same 146 employees, June 2026, and the $400M Series C and the plan to grow to 450 people, August 2026
  22. Intercom, What it takes to automate 81% of your customer service while improving CX, March 2026 (company reporting on its own product)
  23. Business Review, Enrich Labs at $18M ARR with 14 employees and no outside funding, August 2026
  24. The Next Web, ElevenLabs CEO Mati Staniszewski on revenue, teams of five to ten, and no product managers, August 2026
  25. The Next Web, fonio.ai at $10M ARR, one employee to eighty in fourteen months, August 2026
  26. TechCrunch, Remote grew revenue per employee 50% without adding headcount, May 2026; company announcement
  27. TechCrunch, What ClickUp's mass layoff tells us about the future of work, May 2026; The Next Web, ClickUp's 22% cut and $1M salary bands
  28. TechCrunch, monday.com lays off hundreds, July 2026
  29. Freshworks, message from the CEO, May 2026; record Q2 2026 results
  30. Shopify, 2025 Form 10-K (employee count); Q2 2026 financial results
  31. CNBC, Klarna CEO on AI and workforce reduction, May 2025

Private-company revenue and headcount figures are as disclosed by the companies themselves and are unaudited. Where a widely circulated statistic could not be traced to a primary source, it was excluded rather than softened. Benchmark studies are identified by name and sample size so you can judge how much weight each one carries; where two credible surveys disagree, both figures are given.