
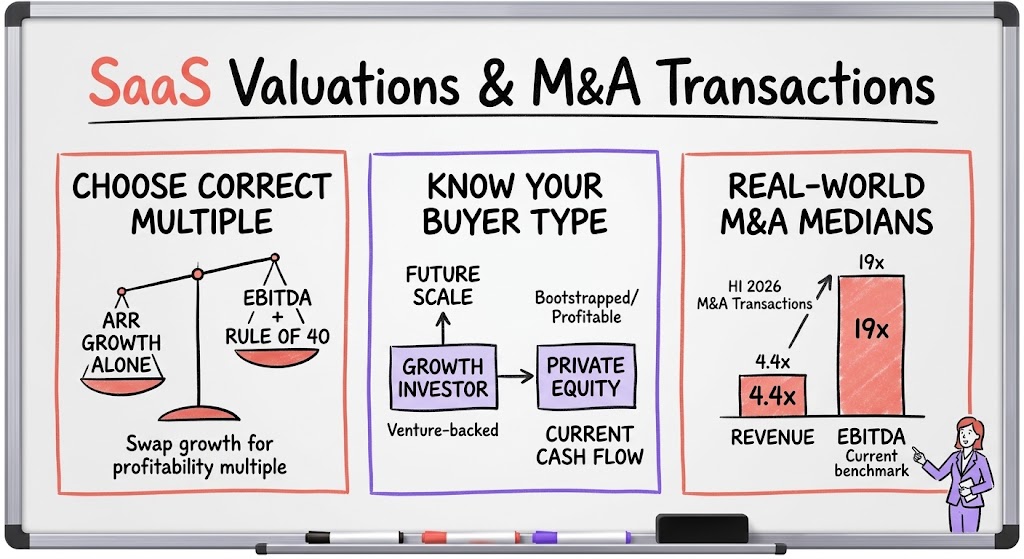
SaaS Valuations & M&A Transactions
Real 2026 data on SaaS revenue and EBITDA multiples, why the number a calculator spits out depends entirely on whose data set it's pulling from, and what actually drives valuation for non-venture-backed SaaS companies.

A founder in our Enterprise Mastermind brought up a SaaS valuation calculator he'd been playing with, built off SaaS Capital's public data, and it sparked one of the more useful valuation conversations we've had this year. He'd noticed something specific: when he adjusted the inputs, the model put almost all of the weighting for valuation on growth rate. His question was whether that made sense for a business like his, where the real strategic choice was whether to pour everything into growth or preserve profitability and skip the next round of hires.
That's a fair thing to push on, because most public valuation calculators are quietly built around one kind of company, and most of the founders in that room were not that kind of company.
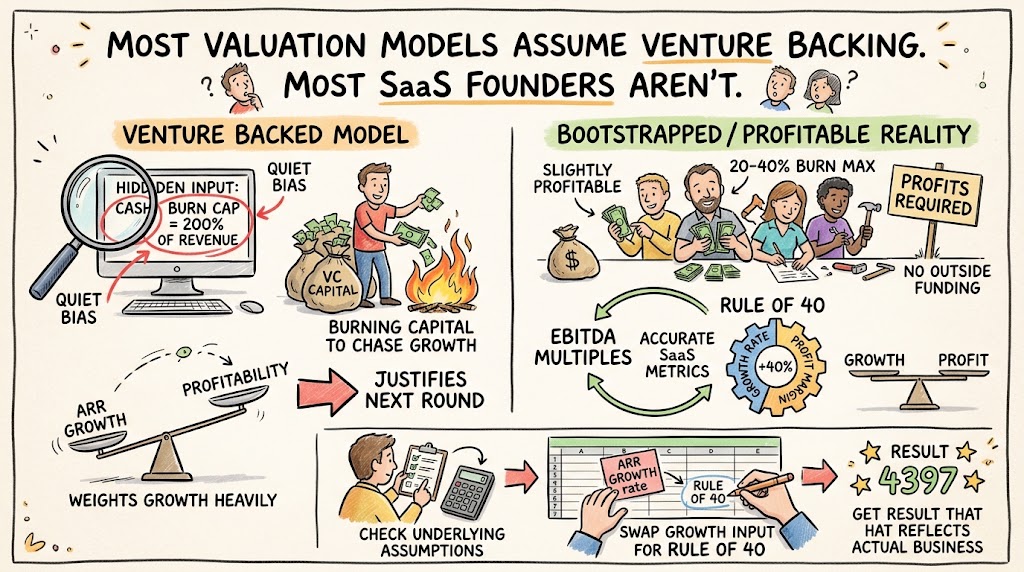
Most valuation models assume you're venture backed. Most SaaS founders aren't.
When I dug into the calculator's assumptions with the group, the tell was in the details. One input capped cash burn as a percentage of revenue at two hundred percent, which only makes sense if you assume the company is venture funded and burning investor capital to chase growth. Of the founders on that call, none were burning anywhere close to that. Companies that aren't venture backed are usually burning somewhere in the twenty to forty percent of revenue range at most, and most of the group was slightly profitable, because that's simply a requirement when you don't have outside capital funding your losses.
- Venture-backed models weight growth heavily. Because growth is often the only lever that matters when a company is burning investor money and revenue growth is what justifies the next round.
- Bootstrapped and profitable companies need a different lens. A more accurate model for a profitable SaaS business looks at EBITDA multiples and the Rule of 40 rather than ARR growth alone.
- Check the underlying assumptions before you trust the output. A single hidden input, like a 200% cash burn cap, can quietly bias an entire valuation model toward one type of company.
My suggestion to the founder was simple: if you're not venture backed, swap the growth rate input for Rule of 40 in that row of the model, and you'll get a result that reflects your actual business a lot better than the out-of-the-box version does.
Where the multiple numbers actually come from
The conversation moved into a more specific question: what multiple is the market actually paying right now? The calculator's public data showed an average multiple of 5.5x, but when the founder checked the current version of the underlying data set from July of this year, it showed 3.8x as the average multiple. That gap is worth understanding, not dismissing, because it tells you how easy it is for a headline valuation number to mislead you.
- Time window matters. A number like 3.8x might be a trailing average over a year and a half or two years, while a snapshot number like 5.5x could reflect a narrower, more recent slice.
- Public versus private matters a lot. Public companies typically trade at roughly a 20% premium over private companies, because public shares carry liquidity that private equity stakes don't.
- Always ask what population the average is drawn from. A multiple built from venture-backed, high-growth companies will look very different from one built across the broader SaaS market.
None of that means the calculator is useless. It means you have to read the fine print on any published multiple before you anchor your own valuation expectations to it.
The numbers I'm actually seeing in the market
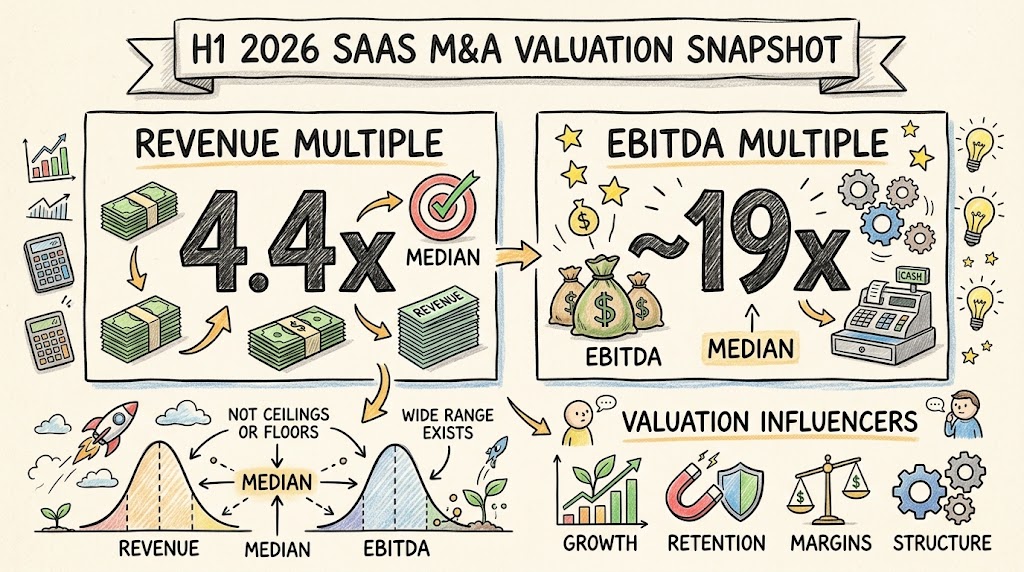
When I ran my own analysis on M&A transaction data from the first half of 2026, the median revenue multiple for SaaS companies came out to 4.4x revenue. For EBITDA, the median multiple was around 19x. Those are the numbers I'd point a founder toward if they want a realistic, current benchmark rather than a single calculator's output, though I'd still encourage anyone using them to think about how their specific business, growth rate, retention, and margin profile compares to that median rather than assuming they'll land exactly on it.
- 4.4x revenue was the median multiple across SaaS M&A transactions in the first half of 2026.
- ~19x EBITDA was the median EBITDA multiple over the same period.
- Both are medians, not ceilings or floors. A big range in valuation multiples exists across deals depending on growth, retention, margins, and deal structure.
Net revenue retention is doing more work than people realize
One detail that came up in the discussion but deserves its own callout is that the more sophisticated valuation models weight net revenue retention alongside growth and EBITDA, not just top-line growth in isolation. That tracks with what I'd expect buyers to actually care about. A company growing thirty percent a year on the back of strong expansion revenue from existing customers is a fundamentally safer bet for an acquirer than a company growing the same thirty percent almost entirely through new logo acquisition, because the first company's growth is far more durable if new customer acquisition slows down.
If you're preparing your business for a future sale or raise, net revenue retention is one of the most valuable metrics to improve well before you're in a process, because buyers and their advisors will dig into it regardless of what the headline growth number says. It's also one of the more forgiving metrics to work on ahead of time. Expansion revenue, upsells, cross sells, seat growth within existing accounts, tends to compound quietly over a year or two if you build the right customer success motion around it, which makes it a good target well before you're anywhere near a sale conversation.
A quick example of how the math actually plays out
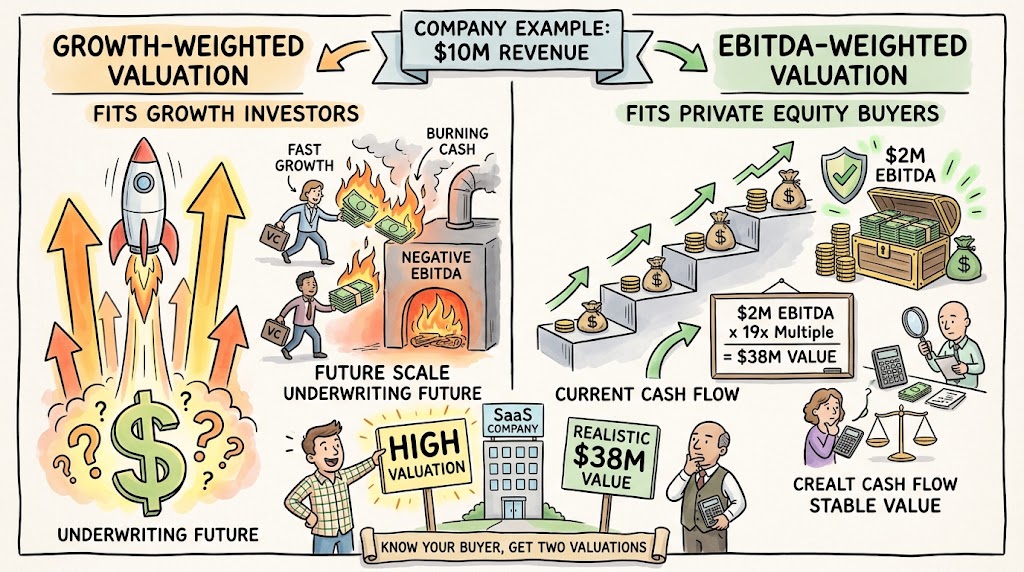
It helps to see the growth-versus-EBITDA tension in concrete terms, since that was the original question that kicked off this whole discussion. Say your company is doing $10 million a year in revenue. If you're growing fast and burning cash to do it, a growth-weighted model might value you primarily off that growth rate, and your EBITDA could even be negative without tanking the number. If instead you're growing more modestly but running at a healthy EBITDA margin, say 20 percent, an EBITDA-weighted approach at something like a 19x multiple would put your value in the neighborhood of $38 million on EBITDA alone, which might be a more honest reflection of what a private equity buyer, as opposed to a growth investor, would actually pay.
- Growth-weighted valuation fits growth investors. Firms writing venture or growth equity checks are underwriting future scale, so they'll weight your growth rate heavily even if you're not yet profitable.
- EBITDA-weighted valuation fits private equity buyers. Firms buying control positions in profitable companies typically anchor much more heavily to current cash flow than to a growth story.
- Know which type of buyer you're actually talking to. The same company can get two very different valuation numbers depending on which side of the table is doing the math.
What this means if you're thinking about a transaction
The practical takeaway from this whole conversation is that valuation math is only as good as the assumptions baked into it, and those assumptions change dramatically depending on whether you're venture backed or bootstrapped, growth stage or profitable, public comp or private comp. Before you lean on any single calculator or headline multiple to set your expectations for a sale or raise, it's worth running the numbers a couple of different ways.
- Run both a growth-weighted and an EBITDA-weighted version. If you're profitable and not venture backed, the EBITDA and Rule of 40 view is probably closer to how a real buyer will see you.
- Anchor to recent, transaction-based data where you can. A median like 4.4x revenue or roughly 19x EBITDA from actual first-half-2026 M&A activity is a more grounded starting point than a single online calculator.
- Improve net revenue retention now, not during diligence. It's one of the clearest levers buyers use to judge how durable your growth actually is.
None of this replaces a real conversation with an advisor who's looked at your specific numbers, but it should at least help you ask better questions the next time someone hands you a valuation multiple as if it were gospel.
One more thing worth keeping in mind: valuation multiples move with the broader market, not just with your own performance. A SaaS company growing steadily and improving its metrics can still see its multiple compress simply because public comps pulled back or capital got more expensive across the board. That's exactly why it's worth revisiting these numbers regularly rather than anchoring to whatever multiple you heard once at a conference two years ago. The market you'd sell into today looks meaningfully different from the market of even eighteen months ago, and it'll likely look different again eighteen months from now.