
How to Build a SaaS Dashboard That Turns Marketing Data Into Predictable Growth
Learn how to turn your SaaS marketing data into predictable growth with a powerful dashboard and KPI system. This guide shows how to track key metrics like CAC, NRR, and funnel performance, visualize results with tools like Baremetrics or Databox, and turn insights into action. It’s a practical roadmap for making data-driven decisions and scaling your SaaS business with confidence.

If you can’t measure it, you can’t manage it. That might sound cliché, but in B2B SaaS, it’s the truth.
After months of building your ABM list, launching outbound, producing content, running ads, and building your sales system, you’ve got a lot in motion. But without proper tracking, you’re flying blind.
The final step in building a scalable SaaS growth engine is measurement — setting up dashboards and KPI systems that make performance visible and decision-making fast.
Here’s how to track the metrics that matter, visualize your company’s performance, and turn your marketing and sales data into a predictable growth system.
This content is from the 16 week B2B SaaS Growth Program that we run twice a year.
Why Tracking Is the Key to Predictable Growth
You’ve probably heard the phrase “what gets measured gets managed.”
That’s never been more true than in SaaS marketing.
Your growth system depends on knowing:
- Which channels are driving your lowest cost per lead (CPL)
- Which leads are converting into customers
- How your lifetime value (LTV) compares to your CAC
- How fast you recover CAC (your payback period)
- How your NRR (Net Revenue Retention) is trending
When you have those numbers in one place, you can make strategic decisions — scaling what works, cutting what doesn’t, and investing where the math proves ROI.
That’s why the best SaaS companies operate from dashboards and KPI sheets, not hunches.
Step 1: Create Your Company Dashboard
Start with a visual dashboard that tracks your recurring revenue and key financial metrics.
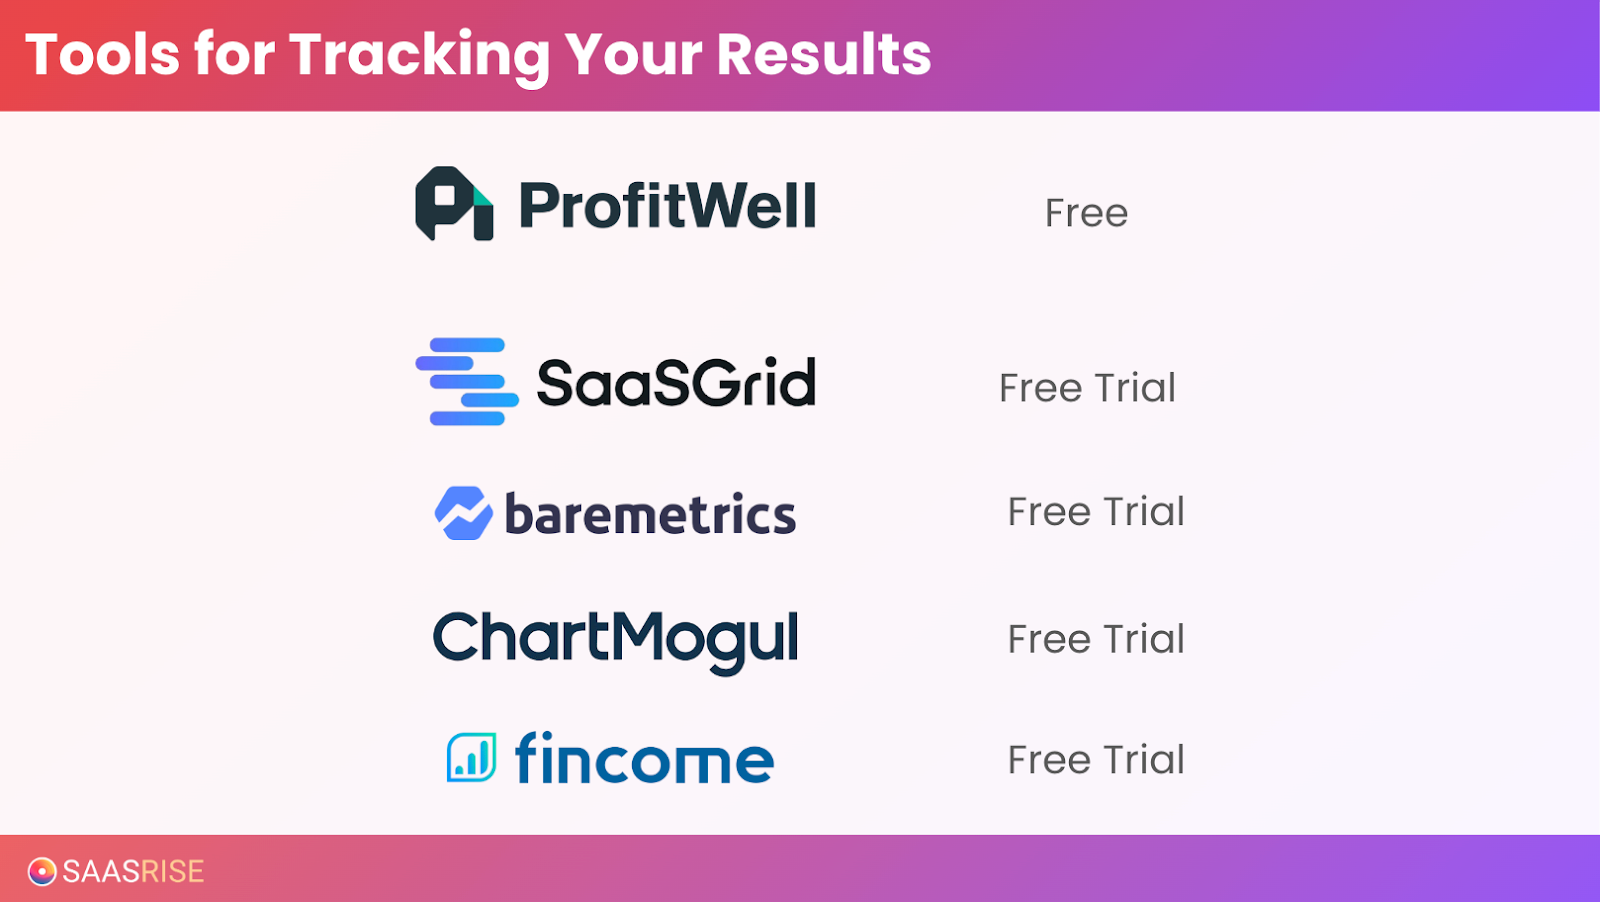
You can set this up using tools like:
- Baremetrics
- ChartMogul
- ProfitWell
- SaaSGrid
- Fincome
These tools integrate with Stripe or your accounting system to pull in your ARR (Annual Recurring Revenue), MRR (Monthly Recurring Revenue), churn, and LTV automatically.
What Your Dashboard Should Show
A strong SaaS dashboard includes:
- ARR and MRR over time
- Net MRR change (new + expansion – churn)
- Active customers or subscribers
- Churn and retention rates
- ARPA (Average Revenue per Account)
- Lifetime Value (LTV)
- CAC payback period
- Net Revenue Retention (NRR)
💡 Pro tip: Don’t just track revenue — track velocity. You want to know how fast new revenue is being added each month and where it’s coming from (ads, outbound, content, or referrals).
Step 2: Track Weekly Marketing Metrics
While dashboards give you a snapshot, weekly metrics keep you in control.
Every Monday, take 20–30 minutes to update your ad results spreadsheet. It’s not glamorous — but it’s the single most effective habit for predictable growth.
Track:
- Impressions
- Clicks
- Click-Through Rate (CTR)
- CPC (Cost per Click)
- CPL (Cost per Lead)
- Cost per Qualified Lead (CPQL)
- CAC (Customer Acquisition Cost)
This is how you identify which campaigns are scaling profitably and which need optimization.
If a channel’s CPL is below your target (from Week 1), scale it up. If it’s above, either improve conversion rates or pause it.
The companies that scale the fastest aren’t the ones who spend the most. They’re the ones who adjust the fastest.
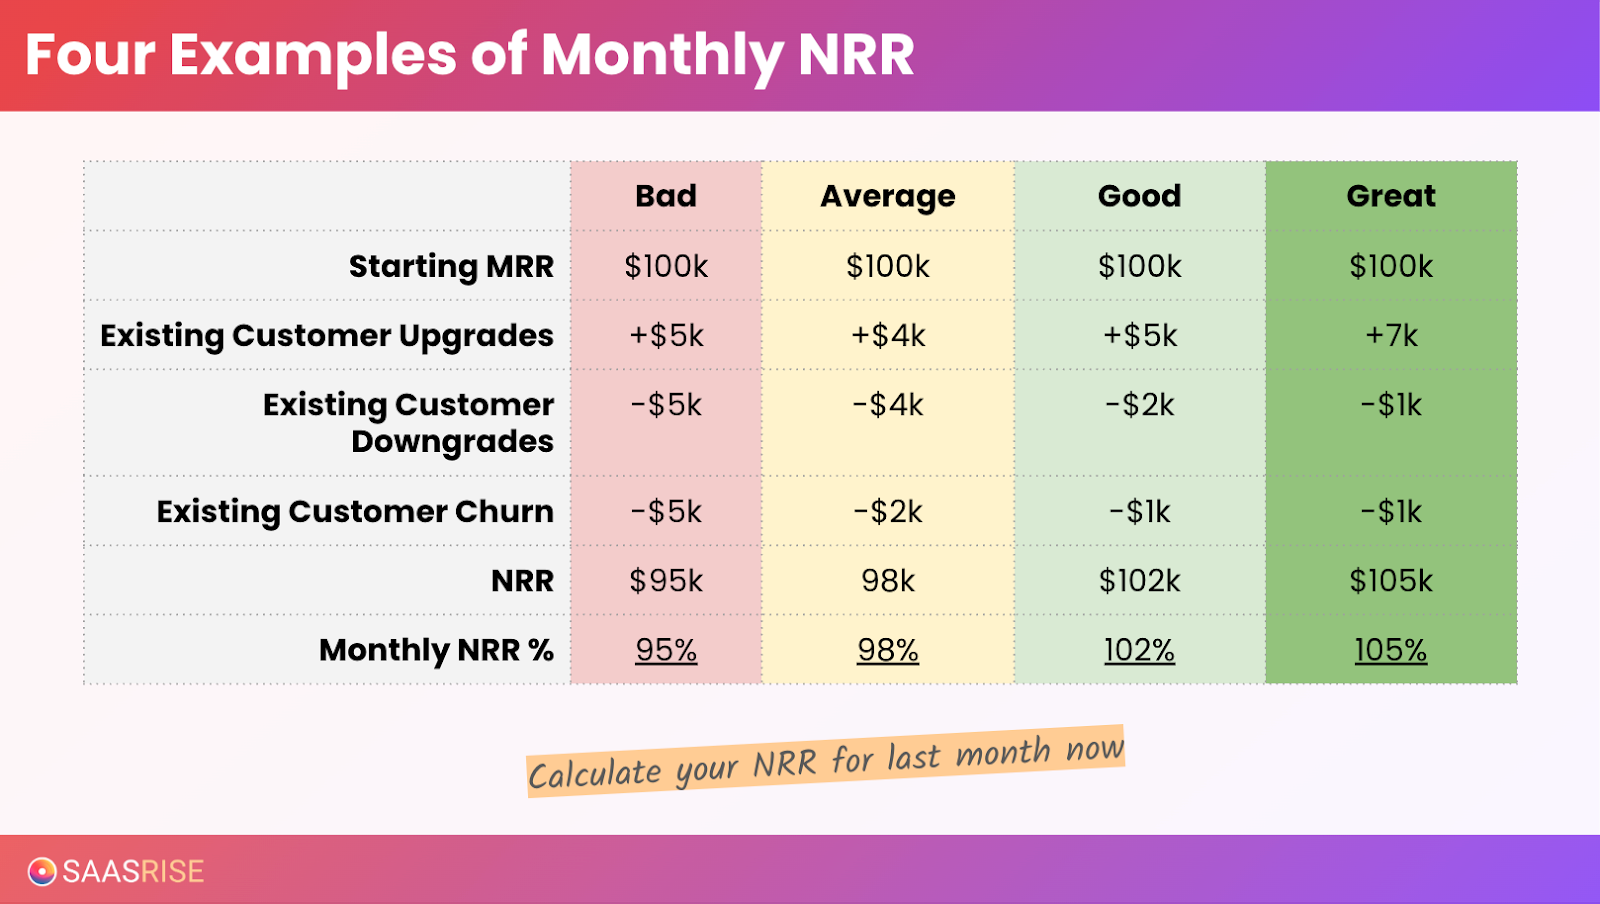
Step 3: Calculate Your Net Revenue Retention (NRR)
One of the most important metrics in SaaS is Net Revenue Retention (NRR) — how much recurring revenue you retain and expand from existing customers over time.
Here’s how to calculate it:
NRR = (Starting MRR + Expansion – Churn – Downgrades) ÷ Starting MRR
You can calculate NRR monthly or annually.
To convert monthly NRR to annual, use compounding math:
1.02 monthly = 126% annual
Even a tiny difference — 99% vs. 101% monthly — compounds into a massive difference in your annual retention.
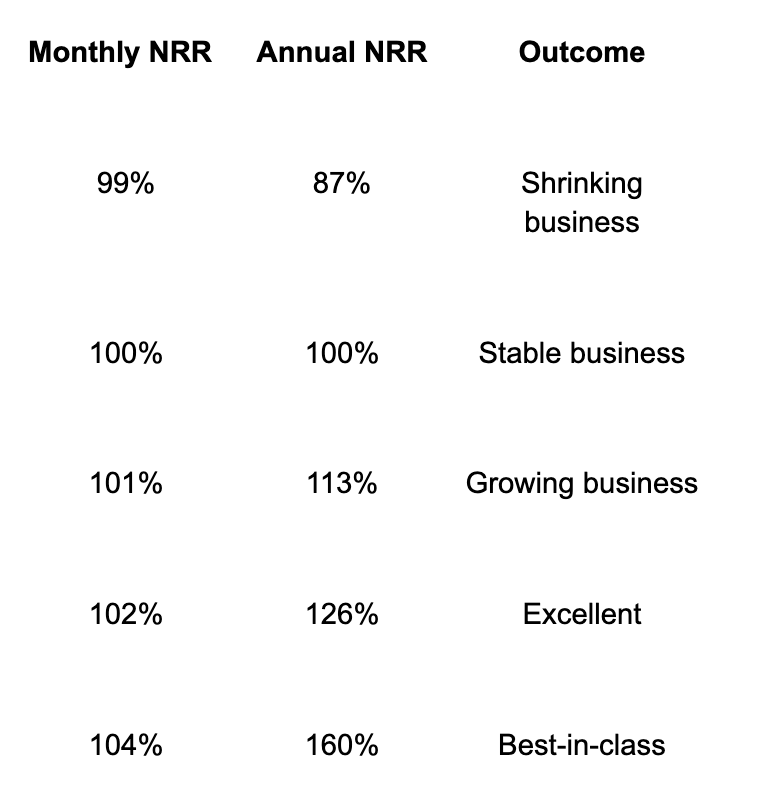
Aim for at least 100% monthly NRR (no net churn). Anything above 102% means you’re expanding your customer base faster than you’re losing it.
Step 4: Review Funnel Metrics
You can’t fix what you don’t understand.
A complete SaaS growth funnel includes:

Every stage can be improved by 10–20%. And when each step compounds, your CAC drops dramatically.
Step 5: Build a Monthly KPI Sheet
Your dashboard shows what’s happening. Your KPI sheet shows why.
Spend 2 hours at the start of each month reviewing:
- Revenue (ARR, MRR, Net MRR Change)
- Leads by source (Ads, Outbound, Content)
- Content impressions (from your Content Machine)
- Ad spend and impressions (from Cometly or your ad dashboards)
- Lead conversion rates
- CAC and LTV:CAC ratio
- NRR and churn
- Email metrics (open and click rates)
It’s simple but powerful — one place to review everything that matters.
Step 6: Use Visualization Tools
Numbers are great, but visuals drive insight.
Once your data is tracked, visualize it. Tools like:
- Geckoboard – integrates with Meta, Google, HubSpot, Cometly, and Slack.
- Databox – ideal for marketing and revenue KPIs.
- Google Data Studio – for custom, free dashboards.
Visual dashboards help your whole team see progress and identify bottlenecks instantly.
Marketing, sales, and success should all have visibility into:
- How many leads came in.
- What CPLs look like by channel.
- What CAC and payback are trending toward.
- How customer retention is holding up.
Transparency creates accountability — and alignment.
Step 7: Make It a Team Habit
Dashboards don’t matter unless you use them.
Every month, set aside a 30-minute leadership review to look at:
- KPI sheet trends (ARR, NRR, CAC)
- Ad results (CPL by channel)
- Content machine growth (monthly impressions)
- Outbound results (click and reply rates)
Ask one question for each metric:
“What improved? What didn’t? What will we test next?”
That’s how you turn metrics into momentum.
Step 8: Use Attribution Tools to Link Ads to Outcomes
To truly understand what’s working, you need cross-channel attribution.
Platforms like Cometly, HockeyStack, and Dreamdata connect the dots between ad impressions, clicks, and revenue.
They help you:
- See which ad networks drive leads that convert.
- Track view-through conversions (people who saw an ad but didn’t click).
- Attribute revenue across multiple touchpoints.
This lets you answer the question that every founder asks:
“Which campaigns actually created customers?”
Once you know that, scaling becomes simple math.
Step 9: Use NRR and CAC as Your North Star
In SaaS, CAC and NRR are your two most important metrics.
They tell you how efficiently you’re acquiring customers — and how well you’re keeping them.
A healthy SaaS business aims for:
- LTV:CAC ratio: 6:1–8:1 (4:1 for VC-backed growth)
- Payback period: 6–9 months (12 for enterprise)
- NRR: 100–120%
If your CAC is too high, optimize.
If your NRR is below 100%, focus on success and retention.
When you balance both, growth becomes sustainable and compounding.
Step 10: Turn Data Into Decisions
The goal of all this tracking isn’t just visibility — it’s action.
Use your dashboards and KPI sheets to:
- Reallocate budgets weekly to your best-performing channels.
- Identify underperforming campaigns and fix them fast.
- Align your marketing, sales, and success teams around shared targets.
- Predict revenue growth three to six months ahead.
When your data tells you where to push and where to pause, you move from reactive to proactive growth.
That’s when your marketing system becomes a revenue engine.
The Takeaway
The companies that scale fastest aren’t the ones with the best ideas. They’re the ones with the best tracking.
Here’s the full playbook:
- Build a visual dashboard with tools like Baremetrics or ChartMogul.
- Update your ad results spreadsheet every week.
- Calculate and monitor your NRR monthly.
- Maintain a KPI sheet for your entire company.
- Review results as a leadership team and take action.
Measure everything. Adjust constantly. Scale what works.
That’s how you turn marketing from a cost center into a predictable growth engine — and transform a good SaaS company into a great one.
This content is from the 16 week B2B SaaS Growth Program that we run twice a year.