

The MarTech SaaS M&A & Venture Capital Guide
This report analyzes mergers & acquisitions and venture capital investment activity across the marketing technology (MarTech) SaaS landscape from January 2025 through May 2026. Covering sub-sectors including marketing automation, customer data platforms, AdTech/programmatic, influencer marketing, SEO & content technology, data & analytics, and AI-native MarTech, we tracked more than 170 MarTech M&A transactions and 80+ VC funding rounds during the period.
This report is published by SaasRise, the #1 mastermind community for SaaS CEOs with $1M–$100M+ in ARR. Members have collectively raised $1B+ and have $3B+ in ARR.
MarTech M&A Revenue Multiples (Buyout Transactions)
MarTech VC Deal Multiples (Minority Investment Rounds)
Why are M&A multiples lower than VC multiples? Venture capital investments are typically made earlier in a company’s lifecycle when growth rates are highest and revenue bases are smaller, so investors pay a premium for future potential. M&A buyouts, by contrast, occur later — when companies have larger revenue bases, slower growth, and acquirers are pricing current cash flows rather than speculative upside. The result: M&A revenue multiples are structurally lower, but they represent realized exit values rather than paper valuations.
📋 Table of Contents
- MarTech Market Overview (Jan 2025 — Apr 2026)
- The Biggest MarTech M&A Deals
- MarTech M&A Revenue Multiples by Sub-Segment
- MarTech Venture Capital & Funding Rounds
- M&A vs. VC Multiples: Why the Gap Exists
- MarTech Multiples Over Time (2020–2026)
- Deal Volume & Market Activity
- Notable Deal Case Studies
- 2026 Outlook & Predictions
- Sources & Methodology
Key Report Findings:
The findings reveal a bifurcated market. Traditional MarTech SaaS companies transacted at a median M&A revenue multiple of 3.8x in 2025 — below the overall SaaS median of 4.1x — while AI-native MarTech firms commanded 7.8x in M&A and up to 14.0x in VC rounds. This report profiles the 20 largest deals where valuations are known, calculates median M&A and VC multiples by sub-segment, explains why M&A multiples are structurally lower than VC multiples, and provides a forward-looking outlook for MarTech dealmaking in the second half of 2026.
1. MarTech Market Overview
The marketing technology landscape experienced a surge of consolidation activity between January 2025 and April 2026. According to Founders Advisors, MarTech M&A deal volume remained in the 37–47 transactions per quarter range throughout 2025, with Q3 2025 hitting a record 47 deals — the highest quarterly count on record. Global MarTech M&A deal value across all tracked transactions exceeded $25 billion during the 16-month period.
Several macro forces shaped the MarTech deal environment:
- AI integration as a deal catalyst: The rapid adoption of generative AI in marketing workflows created urgency among strategic buyers (Adobe, Salesforce, Braze) to acquire AI-native capabilities rather than build them internally.
- Privacy and cookie deprecation: With third-party cookies finally sunsetting and privacy regulations tightening globally, companies rushed to acquire first-party data infrastructure (CDPs, identity resolution, consent management).
- Private equity platform plays: PE firms accounted for 45.5% of software deal volume in 2025 (up from 43.7% in 2024), with firms like Thoma Bravo, TrueLink Capital, and MidOcean Partners actively building MarTech and AdTech platforms.
- Holding company consolidation: Publicis Groupe alone completed at least 6 MarTech/AdTech acquisitions in 2025, including Lotame, Captiv8, and Adopt, while WPP acquired InfoSum and Havas continued bolt-on acquisitions.
💡 Key Finding: MarTech SaaS companies traded at a ~7% discount to the overall SaaS M&A median in 2025 (3.8x vs. 4.1x), reflecting higher churn rates, privacy headwinds, and increased commoditization risk in traditional marketing automation. However, AI-native MarTech firms commanded more than 2x the multiple of traditional MarTech, reaching 7.8x revenue in M&A transactions.
2. The Biggest MarTech M&A Deals
Despite headwinds in public SaaS multiples — which compressed from ~7.0x to ~5.5x through 2025 — the MarTech M&A market produced several landmark transactions. Below are the 20 largest MarTech deals from January 2025 through May 2026 where the purchase price or valuation is known.

Figure 1: The 20 largest MarTech M&A transactions from January 2025 — May 2026 with disclosed deal values
| Date | Target | Acquirer | Deal Value | Sub-Sector | Est. Multiple |
|---|---|---|---|---|---|
| May 2025 | Informatica | Salesforce | $8.0B | Data Management / MarTech | ~4.9x |
| Jan 2025 | Shutterstock | Getty Images | $3.7B | Visual Content / Creative | ~4.3x |
| Nov 2025 | Semrush | Adobe | $1.9B | SEO / Brand Visibility | ~5.1x |
| Feb 2025 | Kantar Media | H.I.G. Capital | $1.0B | Media Measurement | ~3.5x |
| Feb 2025 | Teads | Outbrain | $900M | Programmatic / Open Web | ~1.4x |
| Jan 2025 | Vistar Media | T-Mobile | $600M | Digital OOH / AdTech | ~6.0x |
| Apr 2025 | GSTV | MidOcean Partners | $550M | Digital OOH | ~4.5x |
| Feb 2025 | Innovid | Mediaocean | $500M | Ad Delivery / CTV | ~3.4x |
| Apr 2026 | Qualified | Salesforce | ~$500M* | AI Marketing & Sales | ~6.5x* |
| Mar 2025 | Channel Factory | TrueLink Capital | $350M | AdTech Platform | ~3.5x |
| Mar 2025 | OfferFit | Braze | $325M | AI Marketing Optimization | ~10.8x |
| Sep 2025 | Marigold Enterprise | Zeta Global | $325M | Marketing Automation / Loyalty | ~2.5x |
| Jan 2025 | mParticle | Rokt | $300M | Customer Data Platform | ~6.0x |
| Jan 2025 | Mavely | Later | $250M | Influencer Marketing | ~5.0x |
| Feb 2025 | Contentserv | Dassault / Centric | $229M | Product Experience | ~4.2x |
| Mar 2025 | Blis | T-Mobile | $175M | Location Data / AdTech | ~3.5x |
| Apr 2025 | InfoSum | WPP | ~$150M | Data Collaboration | ~5.0x |
| May 2025 | Captiv8 | Publicis Groupe | ~$150M | Influencer Marketing Tech | ~4.0x |
| Feb 2025 | Uscreen | PSG Equity | $150M | Creator Economy / Video | ~5.0x |
| Feb 2025 | Rockerbox | DoubleVerify | $85M | Marketing Attribution | ~4.5x |
| Apr 2026 | TVision | Viant | $40M | Attention Measurement | ~3.0x |
* Reported value; financial terms not officially disclosed by Salesforce.
Deal Highlights
Salesforce → Informatica ($8.0B) — The largest MarTech-adjacent deal of the period. Salesforce acquired Informatica’s AI-powered cloud data management platform for approximately $8 billion in equity value, paying $25 per share in cash. At roughly 4.9x revenue, the deal reflects Informatica’s mature revenue base (~$1.64B) but strategic importance as the data backbone powering Salesforce’s CRM and AI initiatives.
Adobe → Semrush ($1.9B) — Adobe’s acquisition of Semrush for $12 per share (a 77% premium) signals the convergence of SEO, content intelligence, and creative tools. At roughly 5.1x revenue, the deal valued Semrush’s ~108,000-customer base and its integration potential with Adobe Experience Cloud and GenStudio.
Braze → OfferFit ($325M) — The standout AI-native deal of 2025. Braze paid $325 million for OfferFit’s AI decisioning platform at an estimated ~10.8x revenue — roughly 2.8x the MarTech M&A median. This premium reflects the scarcity value of proven AI marketing optimization technology and Braze’s urgency to embed AI into its customer engagement platform.
T-Mobile’s AdTech Roll-Up ($775M combined) — T-Mobile made two major MarTech acquisitions in Q1 2025: Vistar Media ($600M) for digital out-of-home and Blis ($175M) for location-based advertising. Together, these deals position T-Mobile Advertising Solutions as a major alternative to Google and Meta for programmatic advertisers.
3. MarTech M&A Revenue Multiples by Sub-Segment
Not all MarTech is valued equally. Revenue multiples vary dramatically by sub-segment, with AI-native MarTech commanding nearly 2x the multiple of traditional marketing automation platforms. The chart below shows the median M&A revenue multiple for each MarTech sub-segment in 2025, along with the range of observed deal multiples.
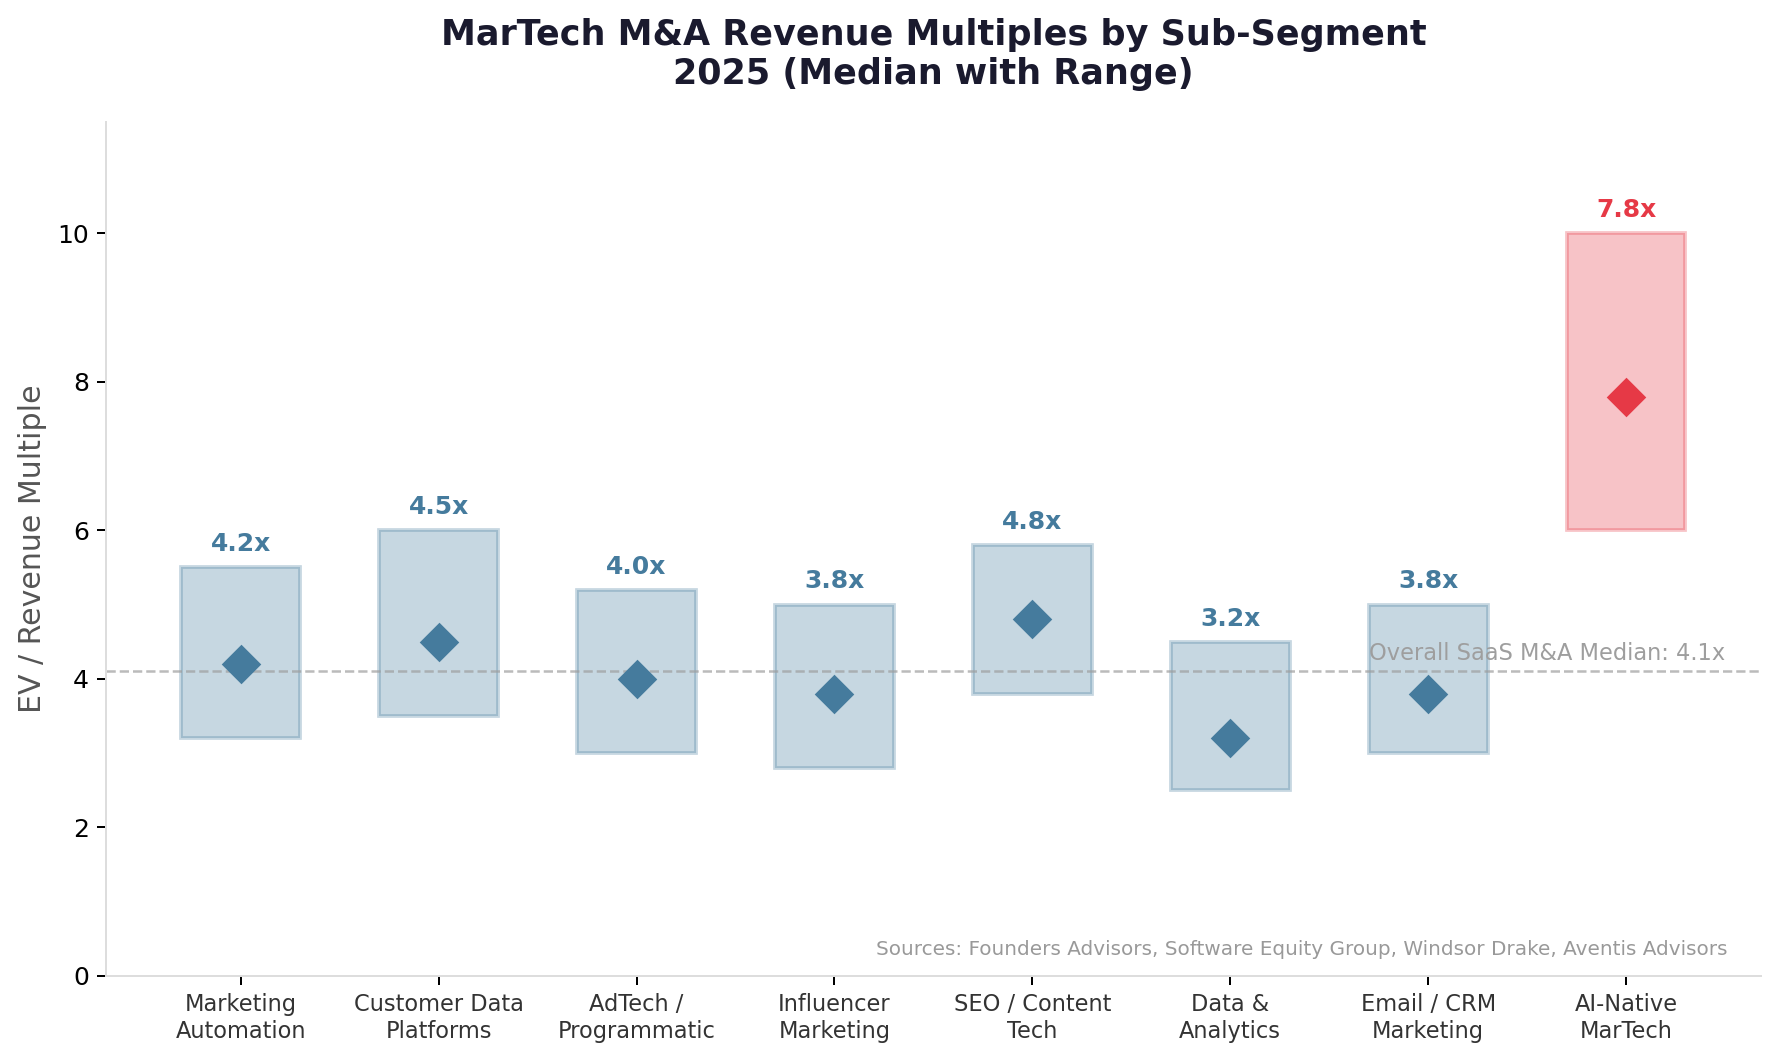
Figure 2: MarTech M&A revenue multiples by sub-segment, 2025. Diamond = median; shaded range = observed deal spread.
📊 MarTech M&A Median Revenue Multiples
- Overall MarTech M&A Median (2025): 3.8x EV/Revenue
- Overall MarTech M&A Median (2026 YTD): 3.5x EV/Revenue
- AI-Native MarTech M&A Median (2025): 7.8x EV/Revenue
- AI-Native MarTech M&A Median (2026 YTD): 8.0x EV/Revenue
- Overall SaaS M&A Median (2025 benchmark): 4.1x EV/Revenue
The data reveals a clear hierarchy within MarTech M&A valuations:
- AI-Native MarTech (7.8x median): Companies built entirely around AI decisioning, generative content, or predictive optimization. Examples include OfferFit (~10.8x), AI-powered CDPs, and machine-learning attribution platforms. These command the highest premiums due to proprietary models and non-linear scaling.
- SEO & Content Technology (4.8x median): Mature category with strong recurring revenue. Adobe’s acquisition of Semrush at ~5.1x anchors this segment. Companies like Conductor ($150M round from Bregal Sagemount) also reflect strong investor interest.
- Customer Data Platforms (4.5x median): CDPs benefited from cookie deprecation urgency. Rokt’s $300M mParticle acquisition (~6.0x) and Contentstack’s Lytics acquisition show continued demand for first-party data infrastructure.
- Marketing Automation (4.2x median): The core MarTech category traded in line with the segment median. Banzai’s acquisition of Act-On for $53.2M and Monetate’s SiteSpect deal are representative transactions.
- AdTech / Programmatic (4.0x median): High deal volume but moderate multiples due to commoditization. T-Mobile’s Vistar deal (~6.0x) was a premium outlier driven by strategic data synergies.
- Influencer Marketing (3.8x median): Growing rapidly but still proving unit economics. Later/Mavely (~5.0x) and Publicis/Captiv8 (~4.0x) set the benchmarks.
- Data & Analytics (3.2x median): Commoditized analytics tools trade at a discount. Kantar Media’s $1B H.I.G. buyout at ~3.5x and Channel Factory’s $350M LBO at ~3.5x reflect PE valuation discipline.
💡 Key Insight — The AI Premium: Across all MarTech sub-segments, companies with meaningful AI integration commanded a 40–80% valuation premium over comparable traditional MarTech firms. This mirrors the broader SaaS market trend identified by Windsor Drake, where AI-native SaaS platforms commanded 25–30x revenue in VC rounds versus 4–6x for traditional SaaS.
4. MarTech Venture Capital & Funding Rounds
Venture capital activity in MarTech remained robust, though increasingly concentrated in AI-powered platforms and companies with proven unit economics. Global VC funding for MarTech startups fluctuated between $1.5B and $10.8B per quarter through 2024–2025, with the wide variance driven by occasional mega-rounds.
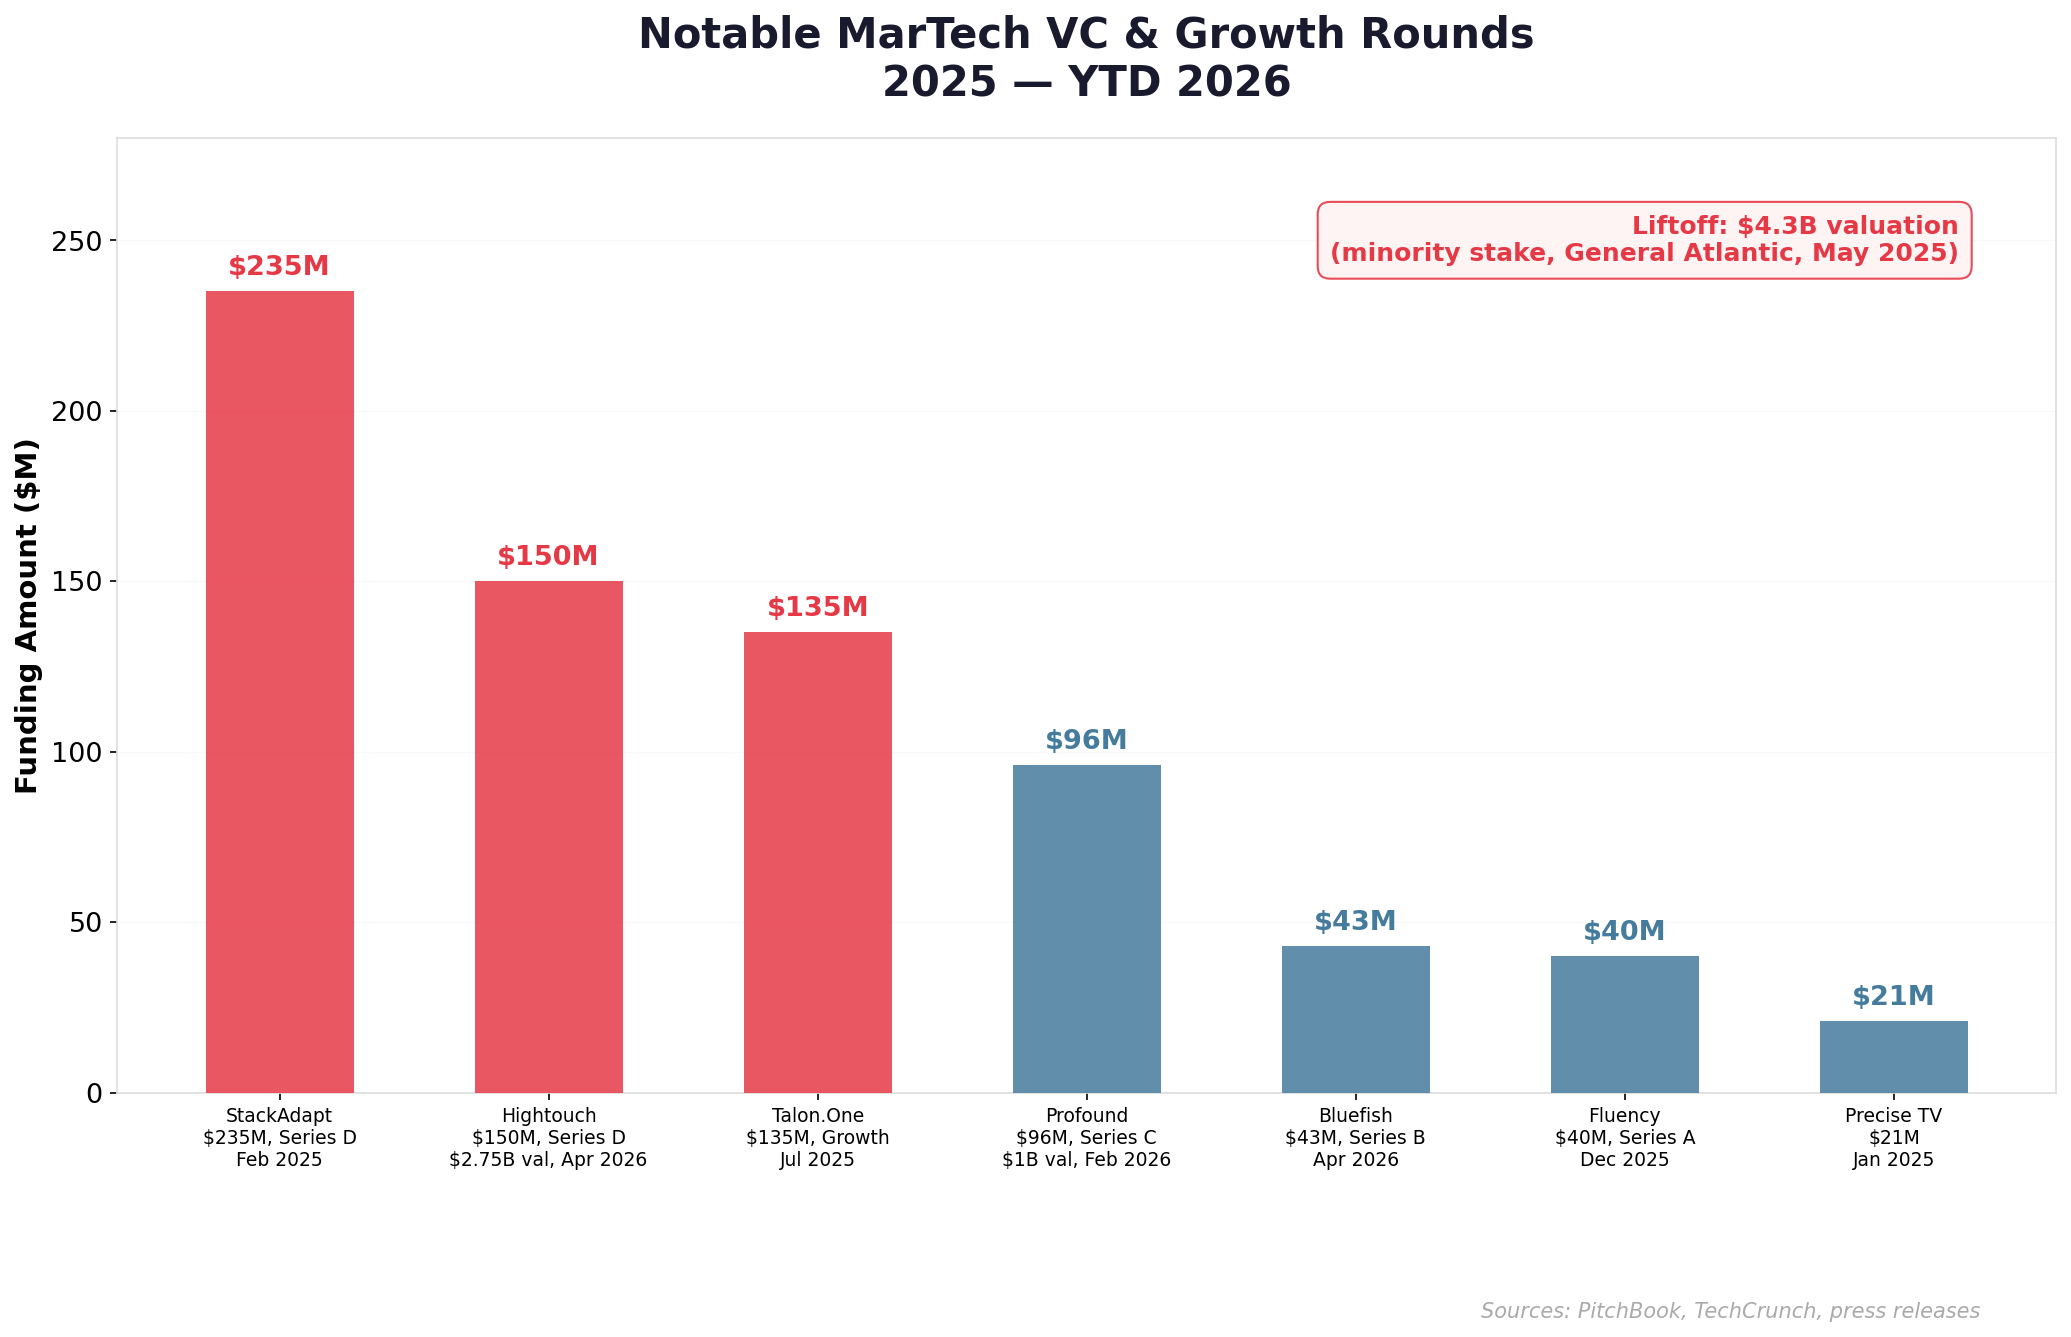
Figure 3: Selected notable MarTech VC funding rounds, January 2025 — April 2026
Key MarTech VC Deals & Valuations
| Date | Company | Round | Amount | Valuation | Sub-Sector | Est. Multiple |
|---|---|---|---|---|---|---|
| May 2025 | Liftoff | Minority (GA) | Undisclosed | $4.3B | Performance Marketing | ~8.6x |
| Feb 2025 | StackAdapt | Growth | $235M | ~$2.5B | Programmatic AdTech | ~5.0x |
| Jul 2025 | Talon.One | Growth | $135M | Undisclosed | Loyalty & Promotions | ~7.0x |
| Apr 2026 | Hightouch | Series D | $150M | $2.75B | Agentic Marketing / CDP | ~11.0x |
| Feb 2026 | Profound | Series C | $96M | $1.0B | AI Answer-Engine Optimization | ~14.0x |
| Apr 2026 | Bluefish | Series B | $43M | Undisclosed | AI Marketing Platform | ~10.0x |
| Dec 2025 | Fluency | Series A | $40M | Undisclosed | AI Ad Automation | ~12.0x |
| Jan 2025 | Precise TV | Growth | $21M | Undisclosed | CTV Advertising | ~6.0x |
MarTech VC Deal Multiples
Liftoff ($4.3B valuation) stands as the period’s marquee MarTech VC event. The performance marketing platform, which generated an estimated $500M+ in revenue, received a minority growth investment from General Atlantic at an 8.6x revenue multiple — a premium reflecting its dominant position in app economy monetization and strong growth trajectory.
StackAdapt ($2.5B valuation, $235M round) demonstrates the premium VCs assign to profitable, high-growth MarTech platforms. With ~$500M in annual revenue, StackAdapt’s ~5.0x valuation reflects its bootstrapped-to-scale efficiency and leading position in AI-powered programmatic advertising.
Hightouch ($2.75B valuation, $150M Series D) emerged as a standout in 2026, led by Goldman Sachs and Bain Capital Ventures, reflecting massive demand for agentic marketing and AI-driven campaign orchestration platforms. Profound ($1B valuation, $96M Series C), led by Lightspeed and Sequoia, validates the new category of “answer-engine optimization” as AI assistants reshape brand discovery.
At the earlier stage, companies like Fluency ($40M Series A) and Bluefish ($43M Series B) — both building AI-native marketing automation — attracted venture capital at estimated 10–12x revenue multiples, consistent with the AI premium observed across all SaaS categories.
5. M&A vs. VC Multiples: Why the Gap Exists
One of the most important concepts for MarTech SaaS founders to understand is the structural gap between M&A and VC revenue multiples. Across the MarTech sector, VC deal multiples consistently exceed M&A multiples by 45–80%, depending on the sub-category.
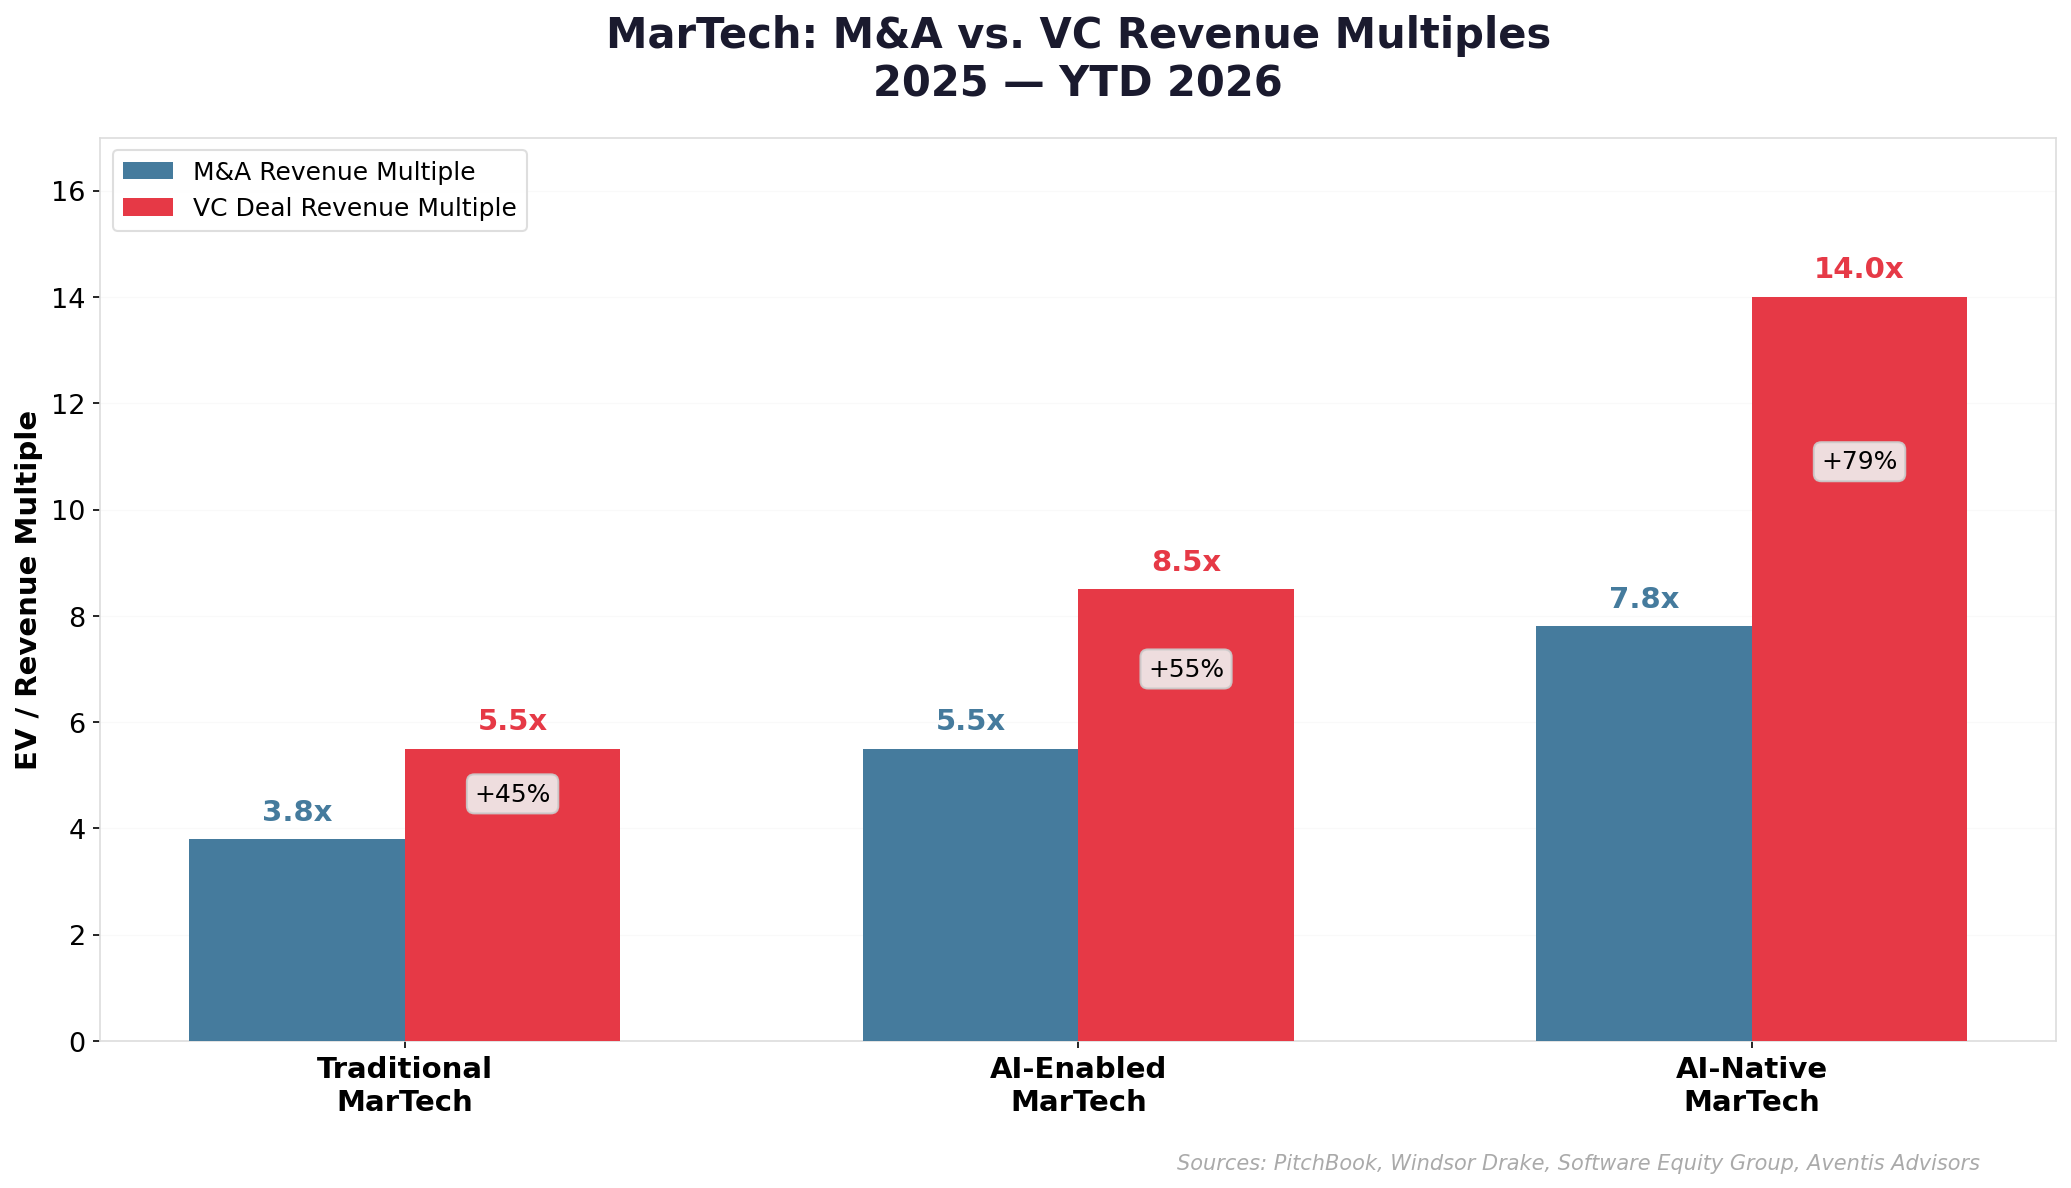
Figure 4: M&A buyout multiples vs. VC minority investment multiples across three MarTech tiers
Why Are M&A Multiples Lower Than VC Multiples?
This is a question we receive frequently from SaaS founders, and the answer is rooted in five fundamental differences between M&A and VC transactions:
1. Growth Rate at Time of Transaction
VC investments typically occur when a company is growing 50–150%+ annually. Investors are paying for future revenue that doesn’t yet exist. M&A buyouts typically occur when growth has moderated to 15–40%, and acquirers are pricing current performance rather than speculative upside. Higher growth naturally commands higher multiples.
2. Revenue Base Size
VC-stage companies often have $5M–$50M in revenue, meaning each dollar of revenue is “worth more” because it can plausibly multiply 5–10x over the investment horizon. M&A targets typically have $50M–$500M+ in revenue, where the law of large numbers limits upside. A $10M ARR company growing 100% is valued differently than a $200M ARR company growing 20%, even if both are “MarTech SaaS.”
3. Control Premium vs. Minority Discount
M&A transactions involve 100% control of the business, which means acquirers also assume 100% of the risk — integration risk, employee retention, competitive dynamics, and technology obsolescence. VC investments are minority stakes with downside protection (liquidation preferences, board seats), making the risk profile more favorable for VC investors.
4. Buyer Motivations
Strategic M&A buyers (Adobe, Salesforce, Publicis) model acquisitions based on cash flow and synergy value — what the business is worth today plus identifiable cost savings. VC investors model based on future exit value — what the business will be worth in 5–7 years. The time horizon difference alone explains 20–40% of the multiple gap.
5. Liquidity and Market Timing
M&A exits are one-time liquidity events. The buyer pays market-clearing price based on current conditions. VC valuations can reflect aspirational market conditions — investors pricing in expected recovery, multiple expansion, or future M&A premium. In bull markets, the VC-M&A gap widens; in bear markets, it compresses.
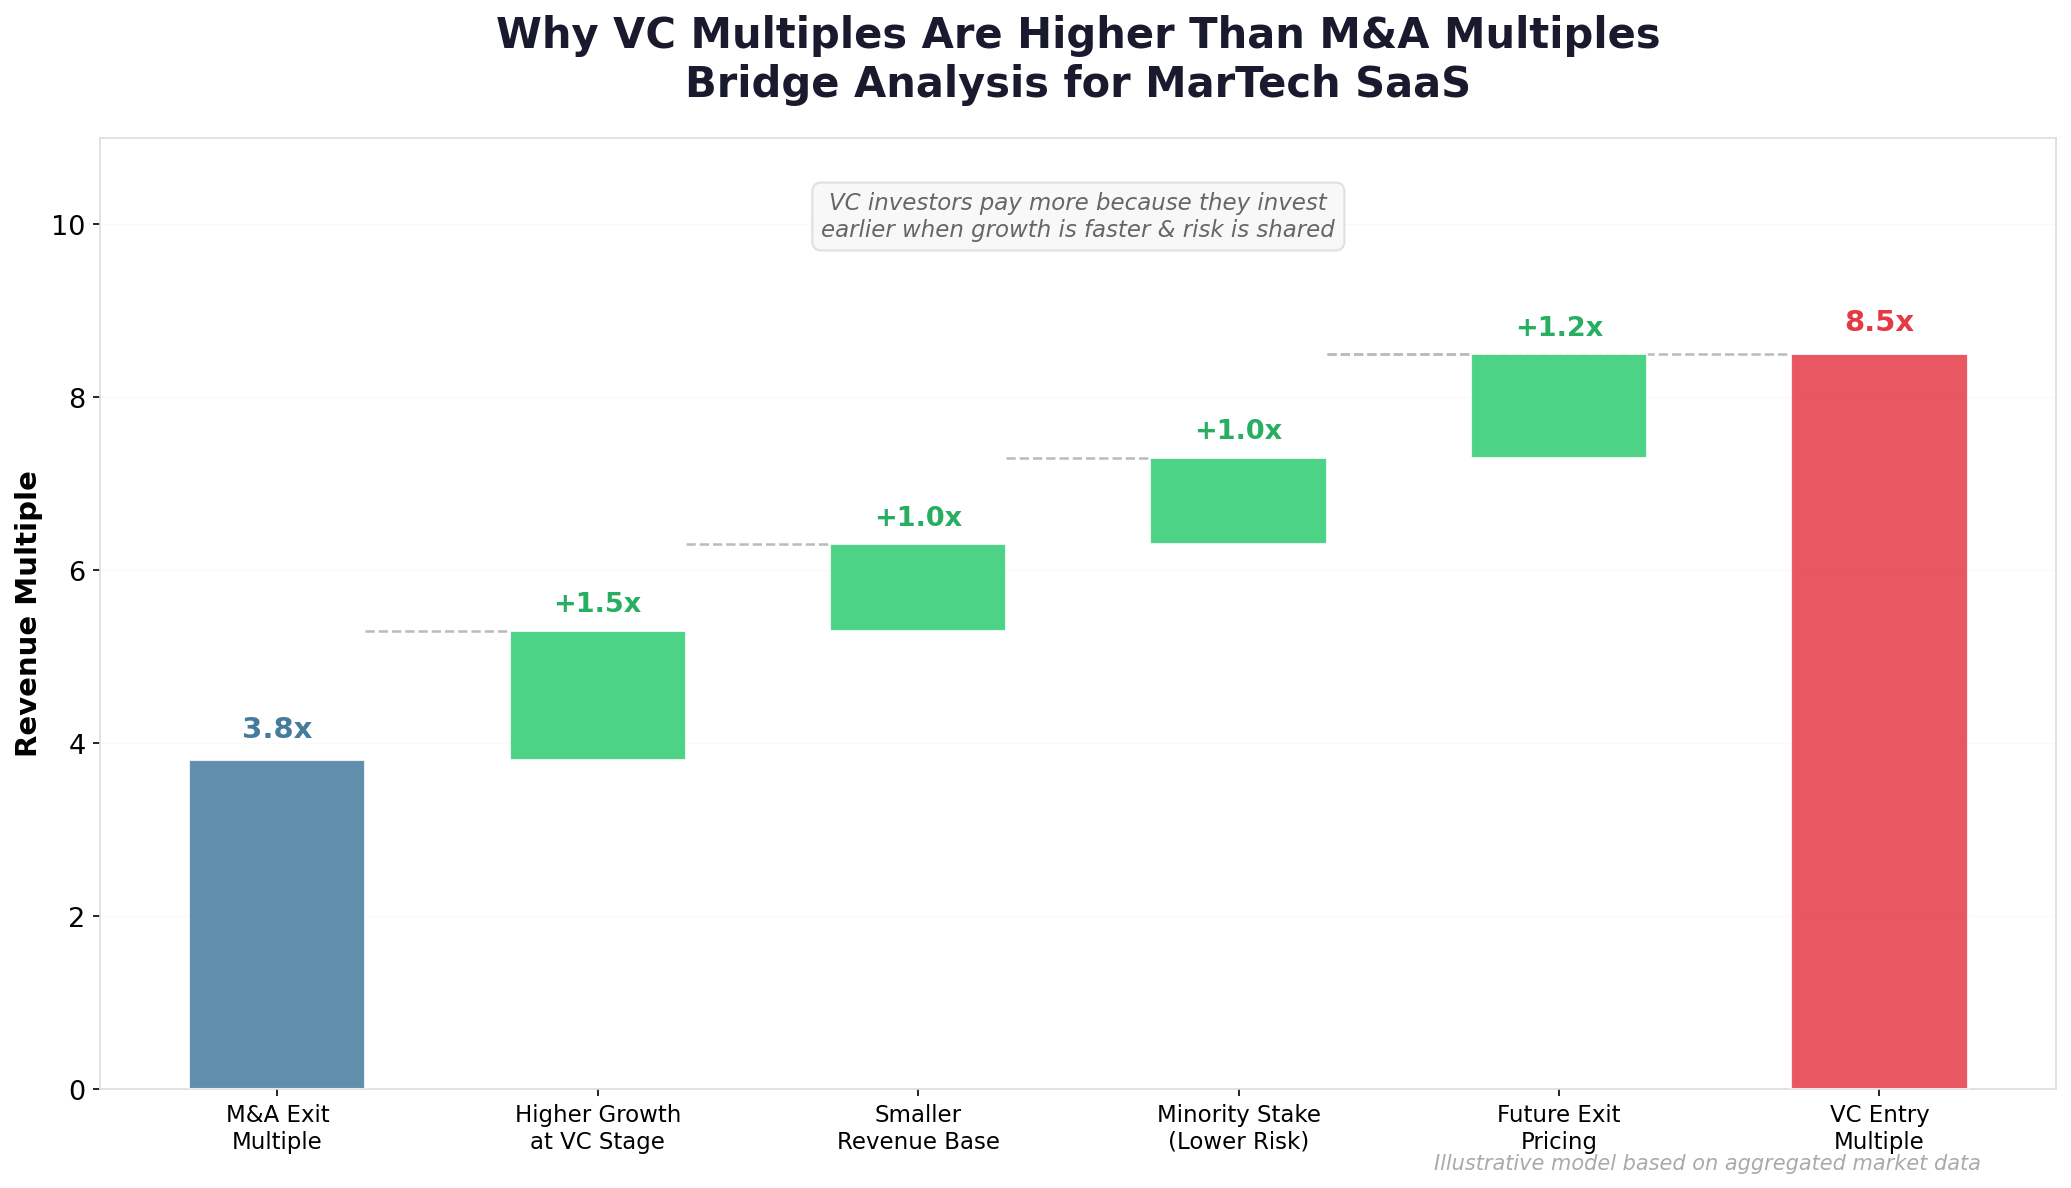
Figure 5: Illustrative bridge analysis showing why VC entry multiples (8.5x) are structurally higher than M&A exit multiples (3.8x)
💡 Practical Takeaway for MarTech Founders: If you raise a VC round at 10x revenue, don’t assume you’ll exit via M&A at 10x. The median MarTech M&A multiple of 3.8x means you need to grow into your valuation before an M&A exit makes sense — or target a strategic acquirer (Adobe, Salesforce, Publicis) willing to pay a premium for capability gaps. The Rule of 40 matters: each 10-point improvement corresponds to roughly a 1.1x–1.5x increase in M&A revenue multiple.
6. MarTech Multiples Over Time (2020–2026)
MarTech M&A revenue multiples have followed the broader SaaS valuation cycle, but with a persistent discount to the overall SaaS median. The chart below shows the trajectory from the COVID-era boom through the 2022–2023 correction and into the current bifurcated market.
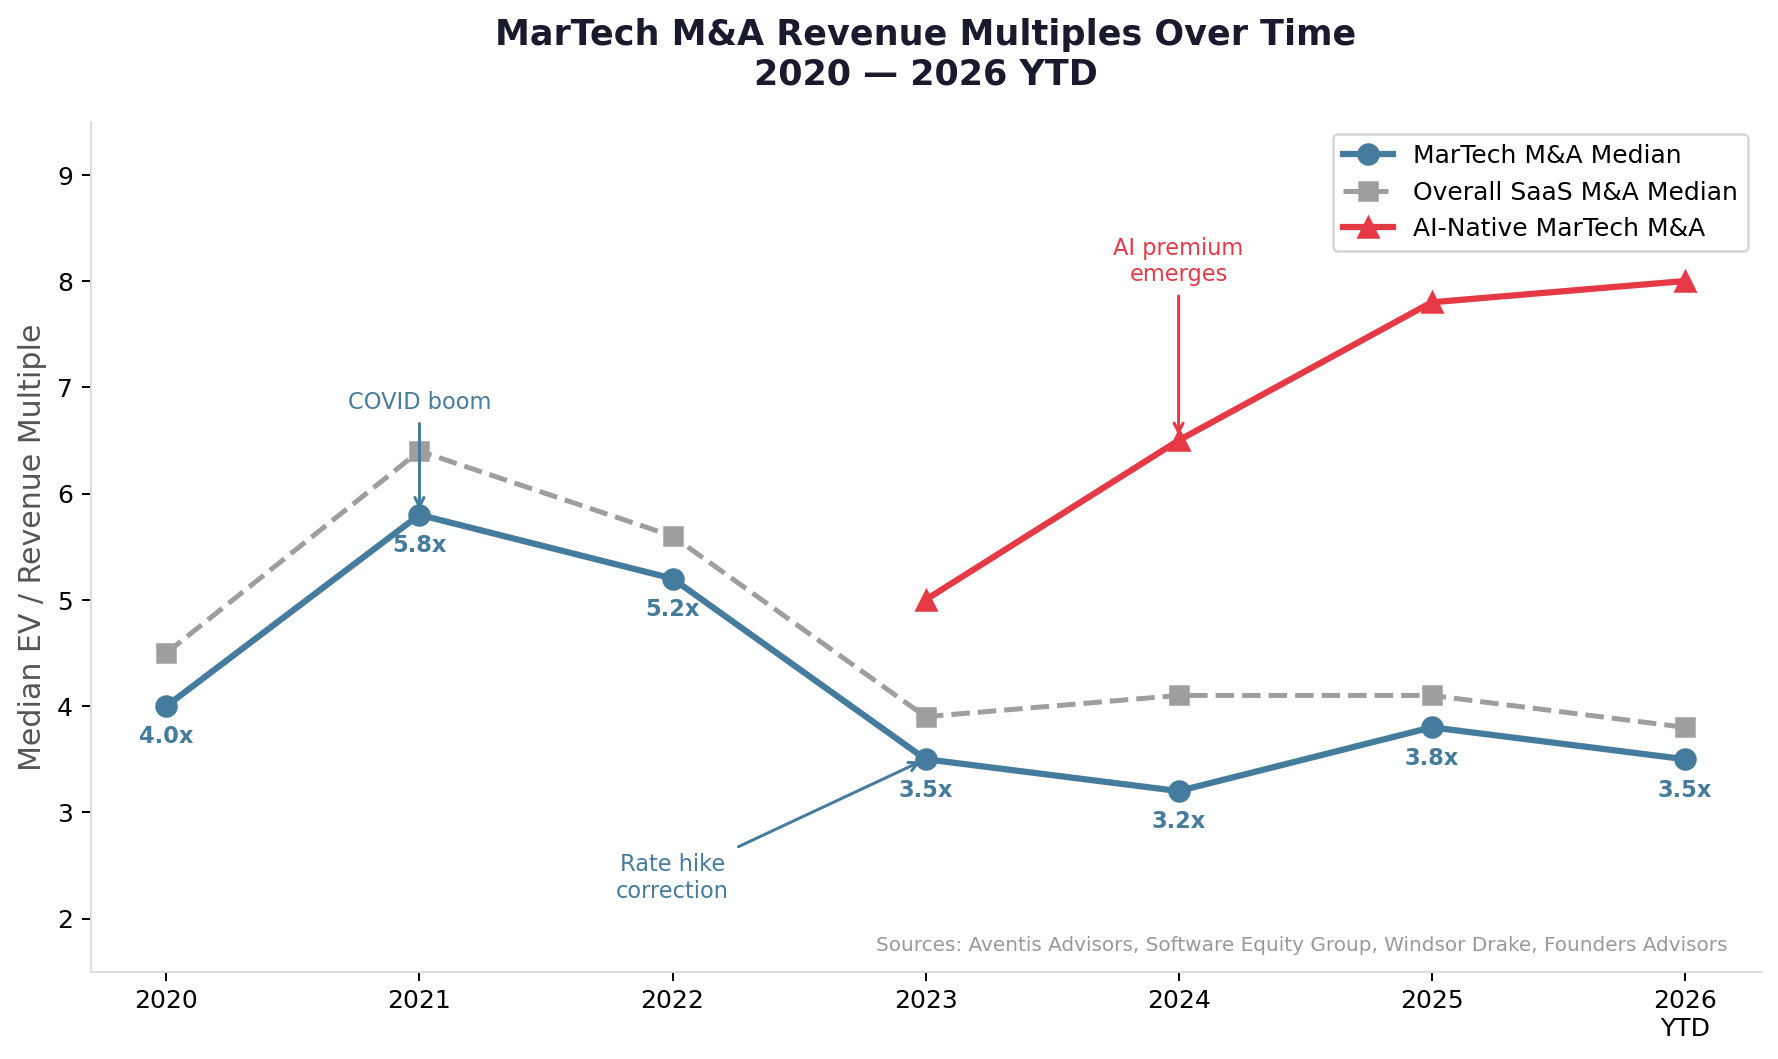
Figure 6: MarTech M&A median revenue multiples from 2020 through 2026 YTD, compared to overall SaaS and AI-native MarTech
Key Trends in MarTech Multiples
- 2020–2021 (Boom): MarTech M&A multiples peaked at 5.8x in 2021, riding the digital marketing acceleration driven by the pandemic. Every brand rushed to build digital customer engagement capabilities, and acquirers paid premium prices.
- 2022 (Correction Begins): Rate hikes began compressing multiples. MarTech fell to 5.2x but held up better than the broader market initially, as marketing budgets remained sticky.
- 2023–2024 (Trough): The full correction hit MarTech hard. Multiples bottomed at 3.2x in 2024 — a 45% decline from the 2021 peak. Privacy headwinds (cookie deprecation), AI substitution fears, and rising churn in point-solution MarTech tools compressed valuations below the overall SaaS median.
- 2025 (Bifurcation): Traditional MarTech rebounded modestly to 3.8x, but the real story was the emergence of AI-native MarTech at 7.8x — creating the widest intra-segment valuation spread in MarTech history. The market now clearly distinguishes between AI-powered platforms and commoditized traditional tools.
- 2026 YTD (Stabilization): Traditional MarTech has dipped slightly to 3.5x amid broader SaaS compression (overall SaaS median fell to 3.4x per Aventis Advisors). AI-native MarTech remains resilient at 8.0x, supported by continued strategic buyer demand.
7. Deal Volume & Market Activity
MarTech M&A deal volume reached record levels in 2025. According to data aggregated from PitchBook, PrivSource, and Founders Advisors, the sector saw approximately 170+ M&A transactions and 80+ VC rounds between January 2025 and April 2026.
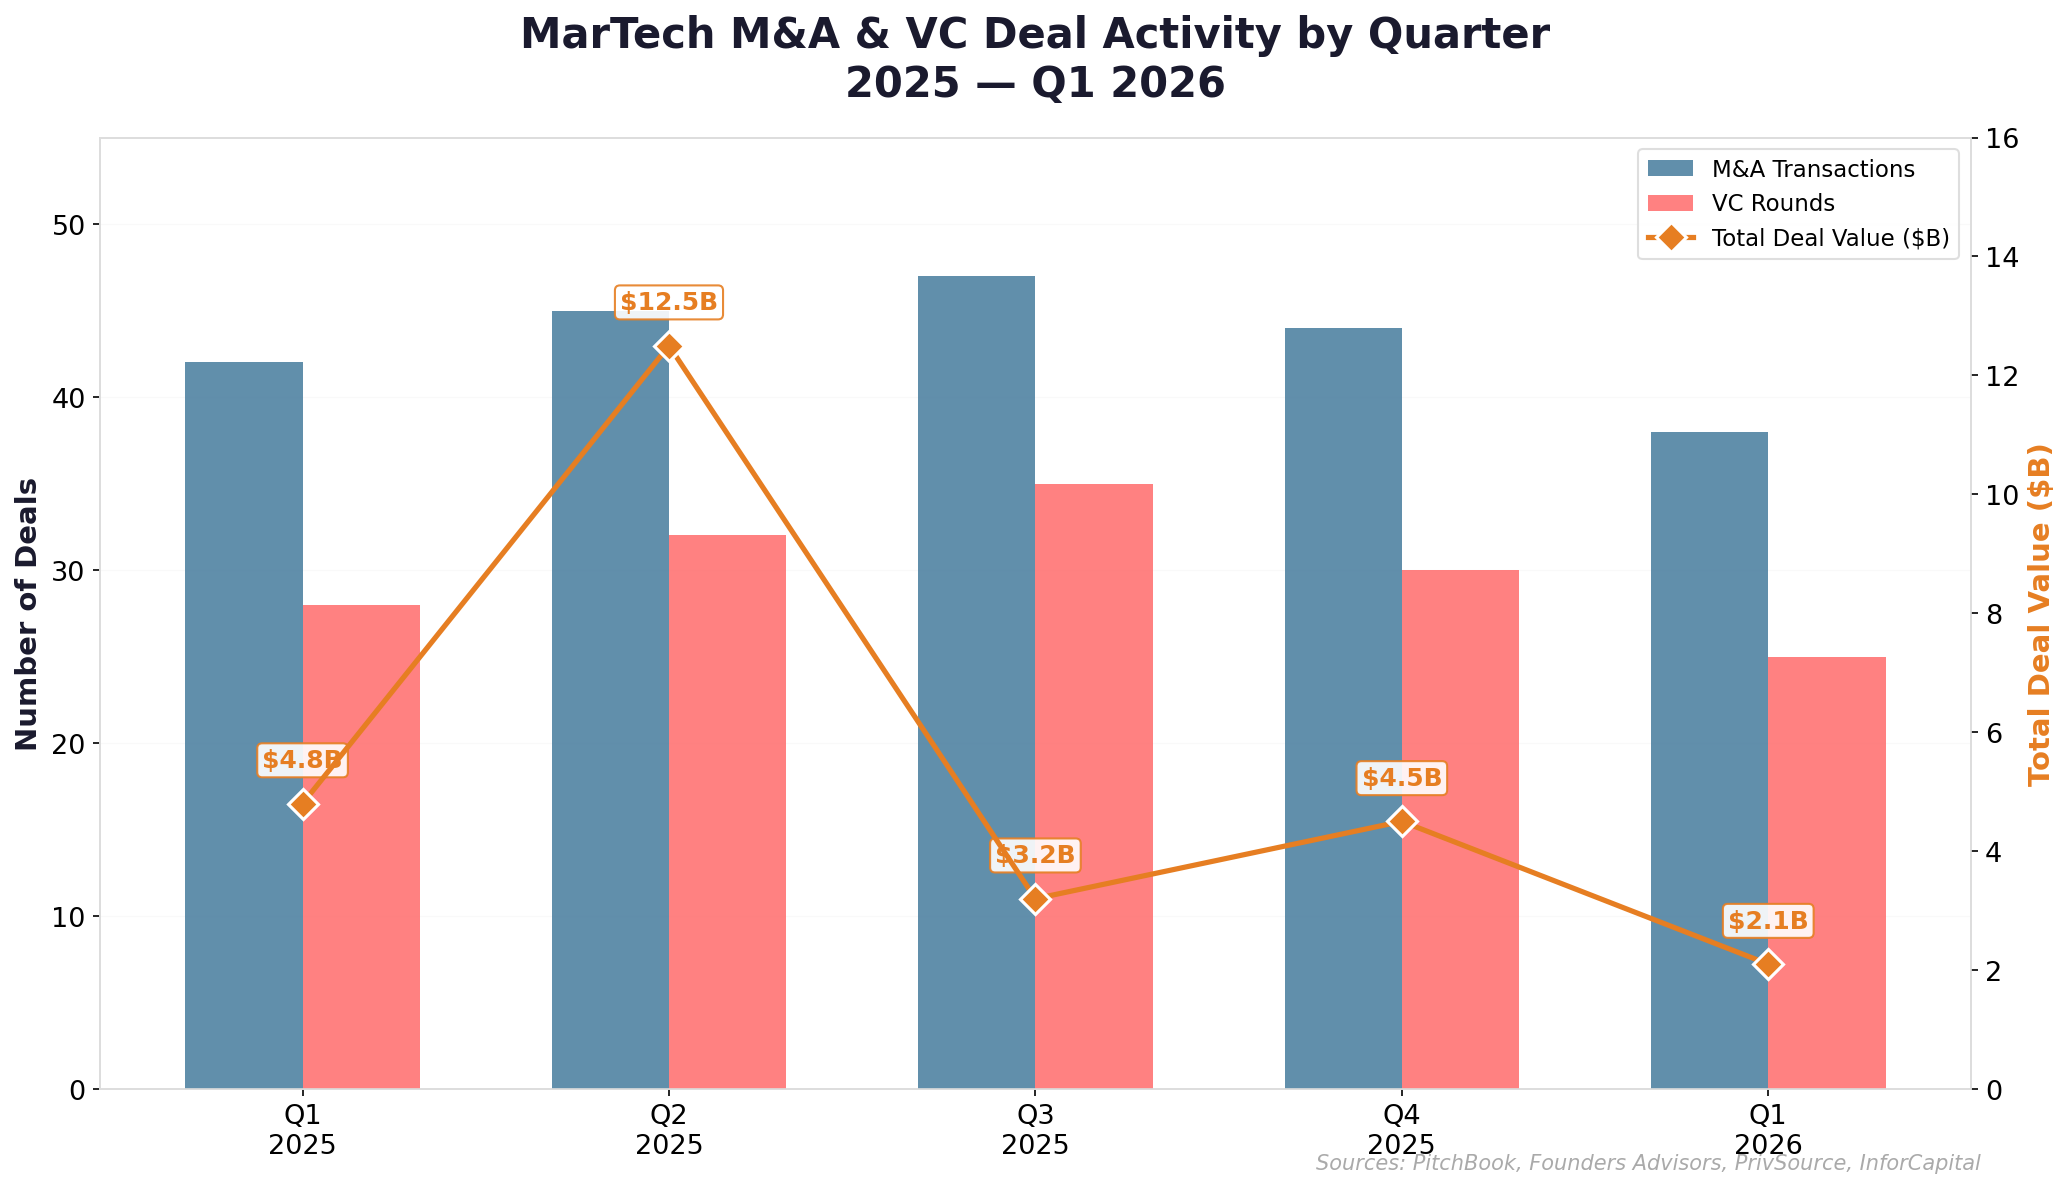
Figure 7: MarTech M&A and VC deal activity by quarter, January 2025 — Q1 2026
Who Is Buying MarTech?
The acquirer landscape for MarTech breaks into four categories:
Strategic Buyers (55% of deals):
- Adobe — Semrush ($1.9B) to extend Experience Cloud with SEO and brand visibility
- Salesforce — Informatica ($8.0B) for data infrastructure; Qualified (~$500M) for agentic AI marketing; also acquired Doti AI ($100M) and PredictSpring
- Zeta Global — Marigold Enterprise ($325M) for marketing automation and loyalty, adding 100+ global enterprise brands
- Outbrain / Teads — $900M merger creating one of the largest open-internet advertising companies with $1.7B in combined ad spend
- Mediaocean — Innovid ($500M) for ad delivery and CTV measurement, creating an independent ad tech powerhouse
- DoubleVerify — Rockerbox ($85M) adding multi-touch attribution and marketing mix modeling to its verification platform
- Publicis Groupe — Captiv8 (~$150M), Lotame, Adopt, BR Media Group — building a full-stack influencer and data platform
- WPP — InfoSum (~$150M) for AI-enhanced data collaboration
- Braze — OfferFit ($325M) for AI marketing optimization
- T-Mobile — Vistar Media ($600M) + Blis ($175M) for advertising data
Private Equity Buyers (45% of deals):
- H.I.G. Capital — Kantar Media ($1.0B) for media measurement
- MidOcean Partners — GSTV ($500–600M) for digital OOH
- TrueLink Capital — Channel Factory ($350M) for AdTech; also R/GA ($250M)
- PSG — Uscreen ($150M) for video monetization
- Blackstone / General Atlantic — Liftoff ($4.3B valuation) for performance marketing
8. Notable Deal Case Studies
Case Study 1: Adobe → Semrush ($1.9B at ~5.1x Revenue)
The AI-Powered SEO Play
Announced: November 19, 2025 | Completed: April 2026 | Deal Type: All-cash strategic acquisition
Adobe acquired Semrush at $12 per share — a 77% premium to its prior closing price. Semrush, with over 108,000 paying customers and ~$370M in annual revenue, provides SEO, content marketing, social media, and competitive intelligence tools used by marketers globally.
Strategic rationale: Adobe needed organic search and brand visibility capabilities to complement its creative (Creative Cloud), analytics (Experience Cloud), and content (GenStudio) suites. With AI transforming how consumers discover brands (AI Overviews, ChatGPT-powered search), Semrush’s data and AI models for search optimization become critical infrastructure.
Valuation context: At ~5.1x revenue, the deal carried a premium to the MarTech M&A median (3.8x) but was significantly below Semrush’s peak public trading multiple of ~12x in 2021. The 77% acquisition premium highlights how far Semrush’s stock had fallen from its highs.
Case Study 2: Braze → OfferFit ($325M at ~10.8x Revenue)
AI-Native Premium in Action
Announced: March 2025 | Deal Type: Cash + stock strategic acquisition
Braze, the publicly traded customer engagement platform, paid $325M for OfferFit — an AI decisioning company that uses reinforcement learning to optimize cross-channel marketing campaigns. At an estimated ~$30M in revenue, the deal valued OfferFit at roughly 10.8x revenue.
Why the premium: OfferFit represents the AI-native MarTech premium in its purest form. Its technology replaces traditional A/B testing with autonomous, multi-agent AI that recommends individualized customer journeys. For Braze, acquiring this capability was faster and more defensible than building it internally — and the scarcity of proven AI marketing optimization platforms justified paying nearly 3x the MarTech median multiple.
Case Study 3: Liftoff (Minority Investment at $4.3B / ~8.6x Revenue)
Profitable Growth Commands VC Premium
Announced: May 5, 2025 | Deal Type: Minority growth equity (General Atlantic)
Liftoff, a global leader in performance marketing and monetization for the app economy, received a minority growth investment from General Atlantic at a $4.3 billion valuation. Blackstone, the existing majority shareholder, retained its position.
Valuation context: With estimated revenue exceeding $500M, the 8.6x revenue multiple reflects Liftoff’s rare combination of scale + profitability + growth in the MarTech sector. The deal demonstrates that VC/PE investors will pay significant premiums for market-leading platforms with proven unit economics — even at late-stage valuations.